
Fig 1. Serum miRNAs differentially expressed in the MPM patients, compared to non-MPM affected controls.
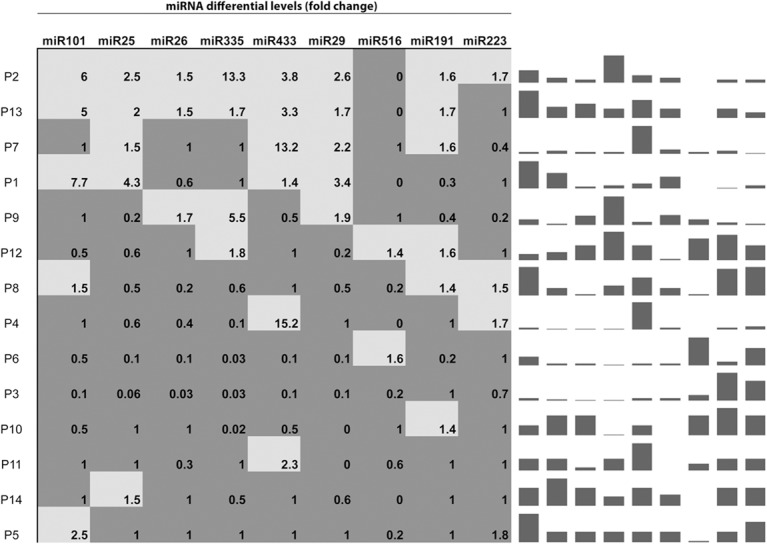
Light gray boxes indicate upregulated miRNAs. Dark grey boxes indicate downregulated/no change/undetectable miRNAs. Spark-line graph refers to the corresponding fold-change differential levels for each miRNA and for each individual patient. Column height in each patient sample, in the spark-line graph, was internally normalized, to show relative expression of various miRNAs within the same signature.