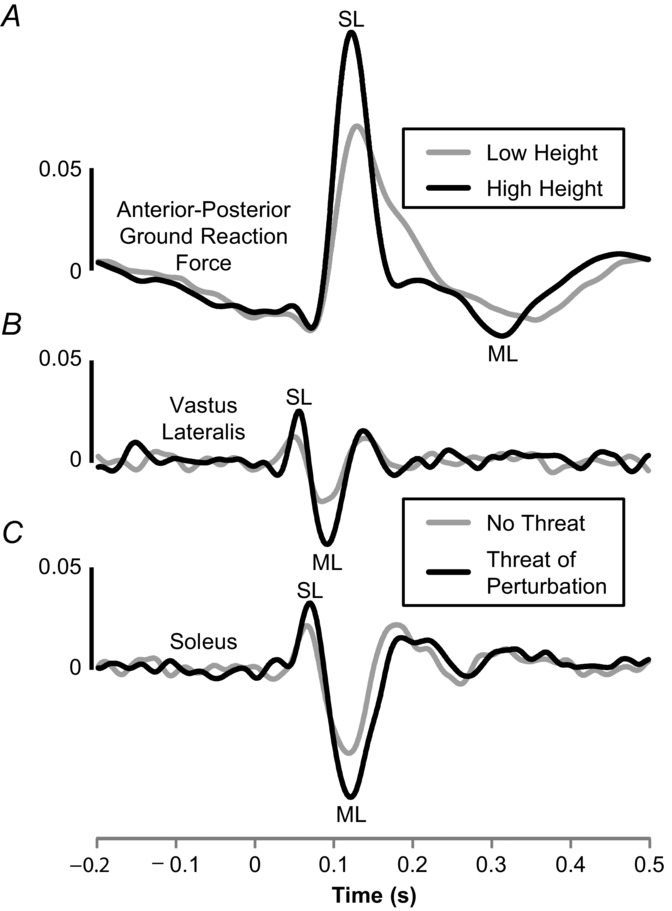
Figure 1.

Short- (SL) and medium-latency (ML) vestibular-evoked balance responses with threat
Amplitude-normalized cumulant density plots representing cross-correlation between stochastic electrical vestibular stimulation (SVS) and anterior–posterior ground reaction forces acting on the body (A), vastus lateralis (B) and soleus muscle activity (C). In all cases, positive peaks reflect a positive correlation between SVS and the respective measure [e.g. a positive current caused a forward-directed force (A) or increase in muscle activity (B and C)]. The ground reaction force trace (A) is reproduced from Horslen et al. (2014; their Fig. 2C); SVS (2–25 Hz bandwidth) evoked balance responses while subjects (n = 10) stood at low and high surface heights with feet at the edge and head turned 90 deg to the right. The muscle activity traces (B and C) were reproduced with permission from Lim (2014; her Fig. 3.12); SVS (0–25 Hz) evoked responses while subjects (n = 13) stood with the head facing forward with and without the threat of laterally directed support surface perturbations.
