
Figure 1.
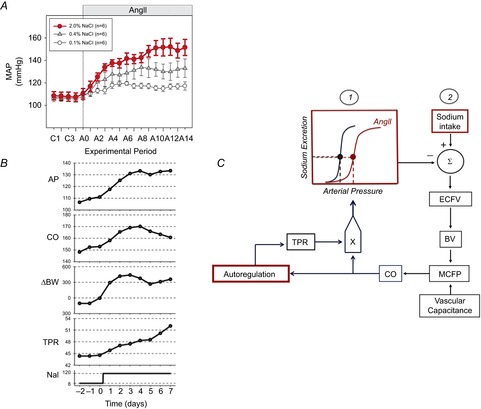
A, the response of mean arterial pressure (MAP) to angiotensin II (AngII) administration (150 ng kg–1 min–1) in Sprague–Dawley rats consuming low (0.1%), normal (0.4%) or high (2.0%) salt diets. Values are 24 h averages measured by radiotelemetry. Figure from Osborn et al. (2011). B, responses of arterial pressure (AP; mmHg), cardiac output (CO; ml min–1 kg–1), body weight (BW; g), total peripheral resistance (TPR; mmHg kg–1 min–1) to increased salt intake (NaI; mequiv) in conscious dogs with ‘clamped plasma AngII’. Figure from Averina et al. (2012). C, simplified representation of the G-C model explanation of the relationship between arterial pressure, sodium excretion and sodium intake in AngII–salt hypertension. The two determinants of the long-term level of arterial pressure are: (1) the renal function curve and (2) sodium intake. The combination of a rightward shift of the renal function curve by AngII and increased sodium intake summates to increase extracellular fluid volume (ECFV), blood volume (BV), mean circulatory filling pressure (MCFP) and therefore cardiac output (CO). Cardiac output directly influences arterial pressure but also gradually increases total peripheral resistance as a result of autoregulation.