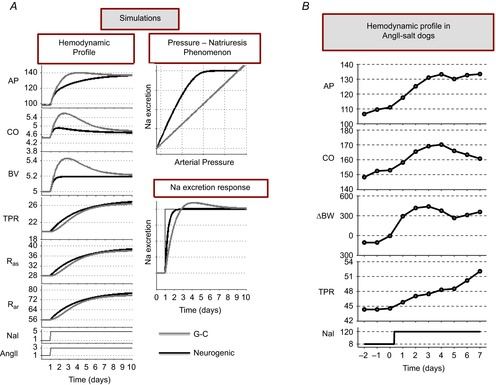
Figure 3.

A, simulations for the G-C model (grey lines) and the neurogenic model (black lines) produced by our mathematical model (Fig. 2). Responses shown are; arterial pressure (AP), cardiac output (CO), blood volume (BV), total peripheral resistance (TPR), arterial splanchnic resistance (Ras), arterial extra-splanchnic resistance (Rar), sodium intake (NaI) and normalized plasma angiotensin II (AngII). Sodium excretion responses are also shown. B, haemodynamic profile of AngII–salt hypertension in dogs (same as Fig. 1B) to be compared to the simulation results in A.
