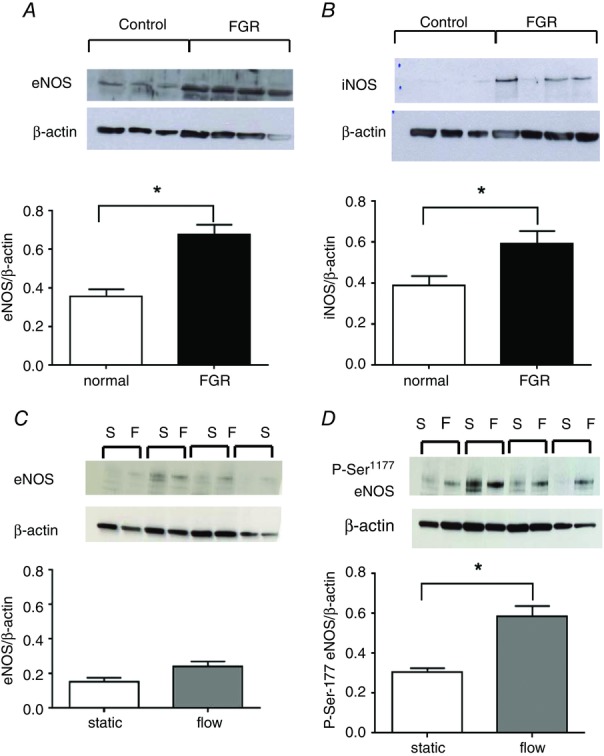
Figure 6.

eNOS expression and activation in control and FGR HPAECs
Western blots were performed on lysates from normal and FGR HPAECs cultured under static conditions (passage 5–8) to detect eNOS (n = 3 and 4, respectively; A), activated and iNOS (n = 7, both groups; B). (Data represented as means ± SEM; *P < 0.05, unpaired t test.) eNOS (n = 7, both groups; C) and activated P-Ser1177-eNOS expression (n = 7, both groups; D) were compared in normal HPAECs following static and shear stress conditions (*P < 0.05, paired t test). Expression was normalised to β-actin expression and is shown as means ± SEM.
