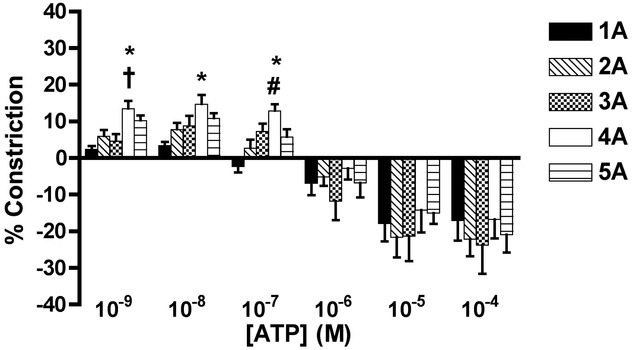
Figure 4.

Arteriolar responses to ATP application at five arteriolar orders
Percentage change in arteriolar constriction (from baseline) for five arteriolar orders (1A through 5A, n = 6–22 arterioles) at increasing logarithmic concentrations (m) of ATP. Data presented as the mean ± SEM. A negative constriction is determined as a dilatatory response. *Statistically different from 1A; #statistically different from 2A; †statistically different from 3A (all P < 0.05).
