
Figure 3. Sequential human CRC primary GI tumor- metastasis formation.
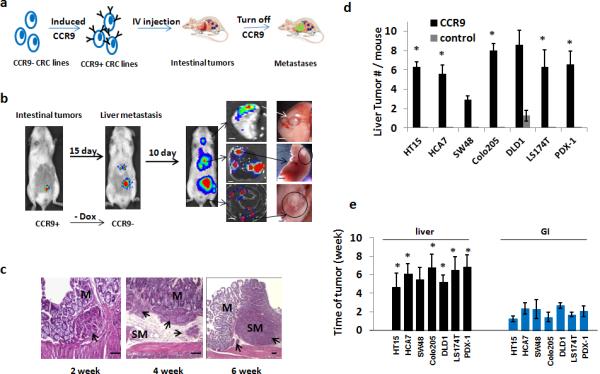
(a).Schematic of sequential human primary CRC and liver metastasis. 6-8 week m/f NSG mice were injected with CCR9+ human CRC cells and monitored by IVIS imaging. Once primary GI tumors were detected, CCR9 expression was silenced by withdrawing doxycycline from drinking water. Mice were monitored using IVIS-luciferase imaging for 4-6 weeks and sacrificed. Blue dots: GI tumors; green dots: metastatic tumors. (b).Representative whole-body IVIS images(CRC line DLD1 as representative) show sequential lower abdominal and right upper quadrant abdominal detectable photons, with ex vivo confirmation of abdominal right upper quadrant tumors as liver- or lung-localized (4X)(n = 8 each for CCR9+ and CCR9− arm for each cell line analyzed).(c).Histopathology (H+E staining) examples of different primary CRC tumors detectable as submucosal (2nd week), with invasion of submucosa (4thweek)and muscularis (6th week). Arrows indicate histopathologically confirmed tumors; M, mucosa; SM, submucosa. Scale bars, 100μ.(d).Quantification of liver metastases in mice (n = 8 each for CCR9+ and CCR9− arm for each cell line analyzed) tail vein injected with control lentiviral vector infected CRC cells (control) or CRC cells with inducible CCR9 expression. * P< 0.05 vs. control by 2-sided Mann-Whitney test. All CCR9+ vs. control cell lines, P=0.001 2-sided Student t test. (e).Time post-injection of cells with inducible CCR9 expression to luciferase-detectable signal in histopathologically confirmed primary GI or liver tumors (n = 8 mice each for CCR9+ and CCR9− arm for each cell line analyzed). ** P< 0.01 by 2-sided Mann-Whitney test. All cell lines liver vs. GI tumors, P=0.001 2-sided Student t test. Also see Supplemental Table 3.