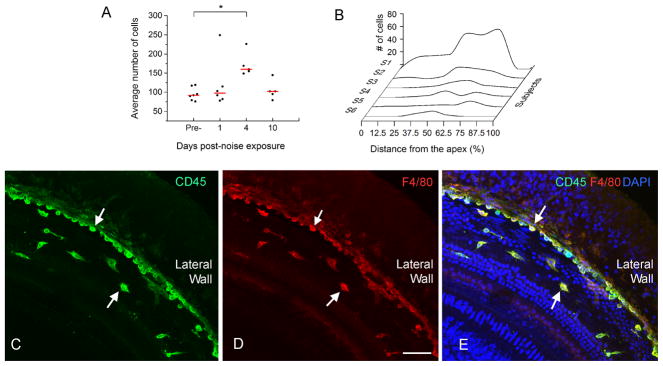
Figure 5. Infiltration of monocytes after acoustic overstimulation.

A: Comparison of the numbers of CD45 positive cells between the control and three post-noise groups. The red lines represent the average numbers of the CD45 positive cells per basilar membrane of the cochlea and the dots represent the numbers of CD45 positive cells in individual samples. The mean value in the 4-day group is significantly greater than in the control group (One way ANOVA on Rank, H=9.4, df = 3, P = 0.024, Dunn’s method for post hoc all pairwise multiple comparison, 4-d vs. normal, q = 2.93, P < 0.05). B: Distribution of CD45 positive cells that had the monocyte morphology along the basilar membrane of the six cochleae examined at 1 day post-noise exposure. Small clusters of the positive cells are present in the middle section of the basilar membrane (approximately 30 to 70% from the apex). Large clusters of CD45 positive cells spread toward both the apical and basal direction with more cells in the basal section. Y axis: the number of CD45 positive cells/600 μm. S1 to S6 indicate the data of individual cochleae. The data points are connected using the Akima Spline interpolation algorithm. C, D and E: A typical distribution pattern of the infiltrated monocytes in the middle section of a noise-damaged cochlea that was examined at 4 days post-noise exposure and was stained with CD45 (green fluorescence in Fig. 5C), F4/80 (red fluorescence in Fig. 5D) and DAPI (blue fluorescence in Fig. 5E). Notice that a large number of cells showing the monocyte morphology are accumulated in the juncture between the basilar membrane and the lateral wall (arrows). Bar in D = 50 μm.
