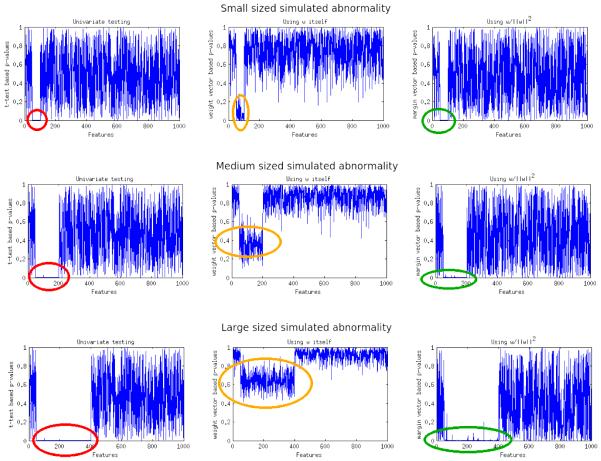
Figure 5.
(Left column) p-values generated using t-tests with red circles indicating the location of the ground truth simulated effects (Middle column) p-values generated using SVM weights alone as described in (Gaonkar and Davatzikos, 2013). Note that as the size of the simulated abnormality is increased the p-values increase to as high as p=0.8. Orange circles indicate the approximate location of ground truth (Right column) p-values generated using the margin based statistic. Green circles indicate approximate location of ground truth.

