
Figure 10.
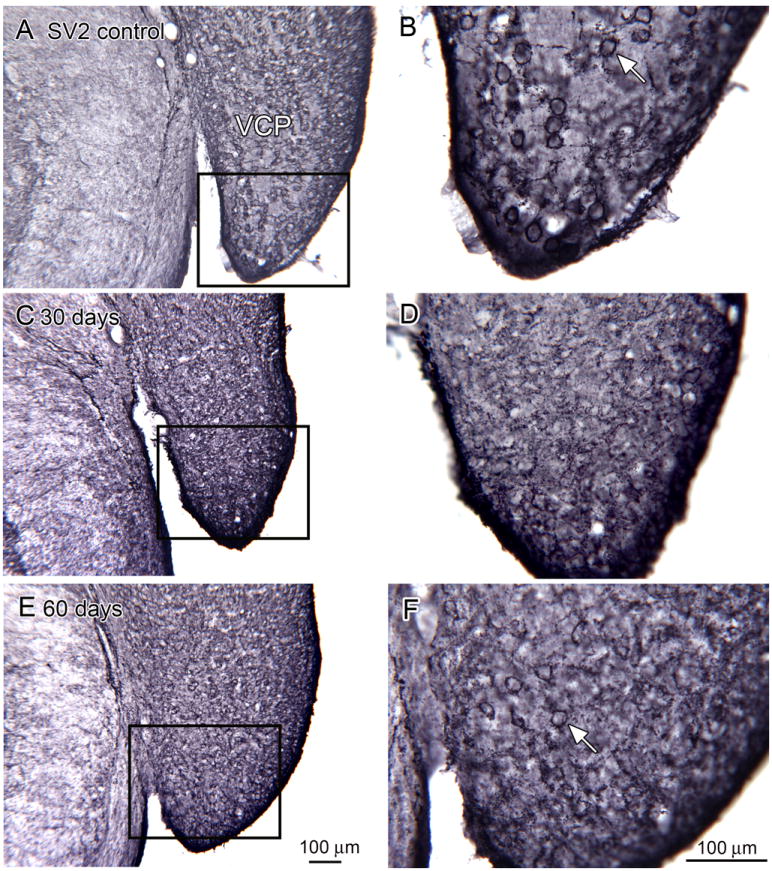
SV2 expression in the VCP in control (A, D; bregma -11.195), 30 day survival (B, E, bregma -11.195) and 60 day (C, F, bregma -11.195) animals. The rectangles in A, C, and E indicate the locations of the higher-magnification images in B, D and F.