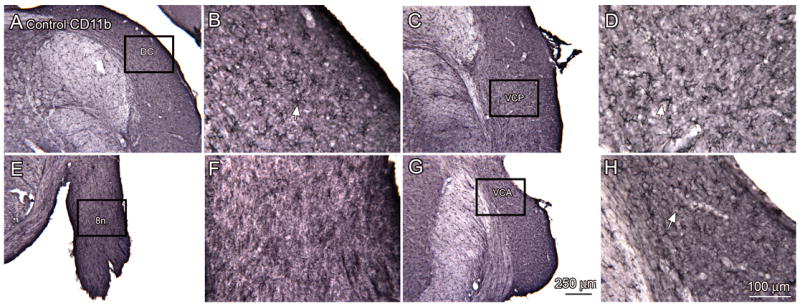
Figure 4.

Distribution of resting microglia in the CN, sections from control animals. For each pair of images, the rectangle on the lower magnification image (A, C, E, G) shows the location of the higher magnification in the immediately adjacent panel (B, D, F, H.) A, B. DCN (bregma -11.261). The arrow in B shows an example of a labeled microglial cell. C, D. Resting microglia in the VCP more ventral on the same section (bregma -11.261). E, F. Absence of microglia in the 8n (bregma -11.030). G, H. Microglia in the VCA (bregma -9.974). Scale bar in G also for A, C, E. Scale bar in H also for B, D, G.
