
Figure 5.
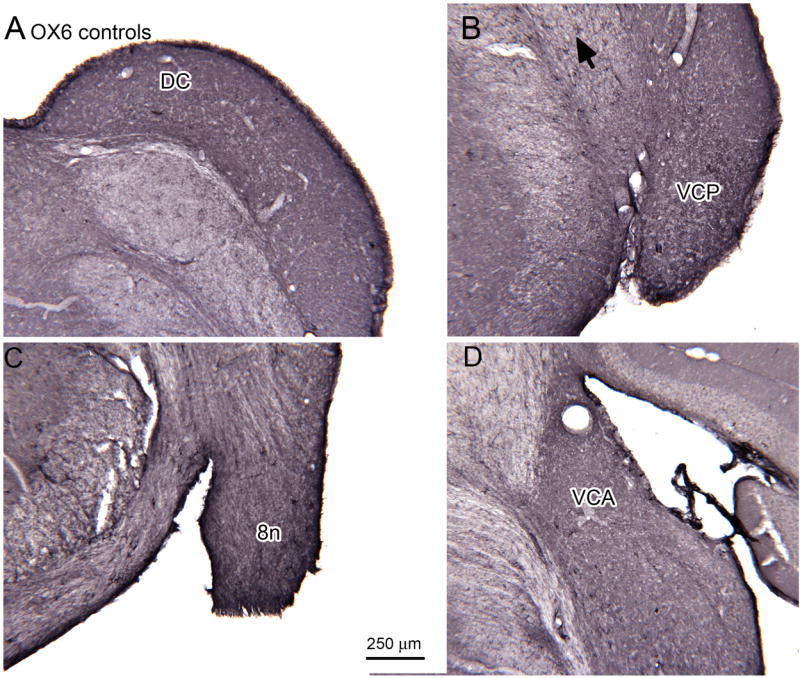
Absence of OX6-ir activated microglia in the CN of 30 day survival control animals shown on sections at four different levels; A is the most caudal. A. DC (bregma -11.624). B. VCP; the arrow indicates a labeled profile (bregma -11.195). C. 8n (bregma -10.964). D. VCA (bregma -10.370). Scale bar in C also for A, B, D.