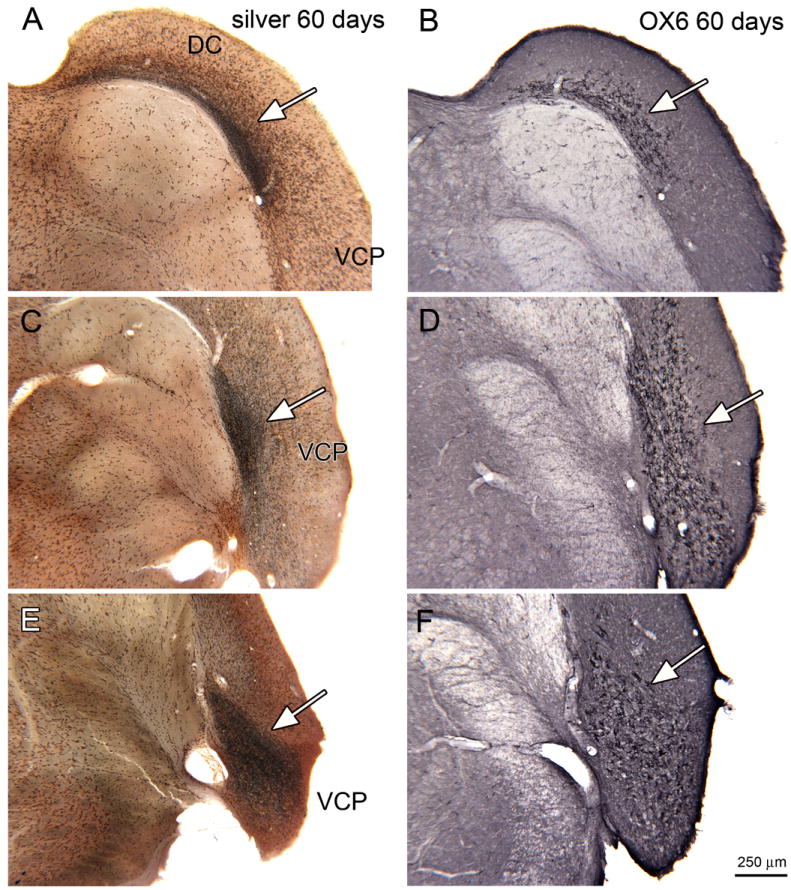
Figure 8.

Silver staining and OX6 expression in the CN, 60 day survival. A. Silver staining on a section through the DC (bregma -11.624). The arrow shows the black band of stained fibers. B. An adjacent section immunostained to show OX6 expression. C. Silver stained section through VCP, the arrow indicates the region of darkest staining (bregma -11.591). D. Adjacent section showing the pattern of OX6 immunolabel, arrow. E. Silver staining in VCP (arrow; bregma -11.228). F. Parallel expression of OX6 (arrow). Scale bar also for A-E.
