
Figure 9.
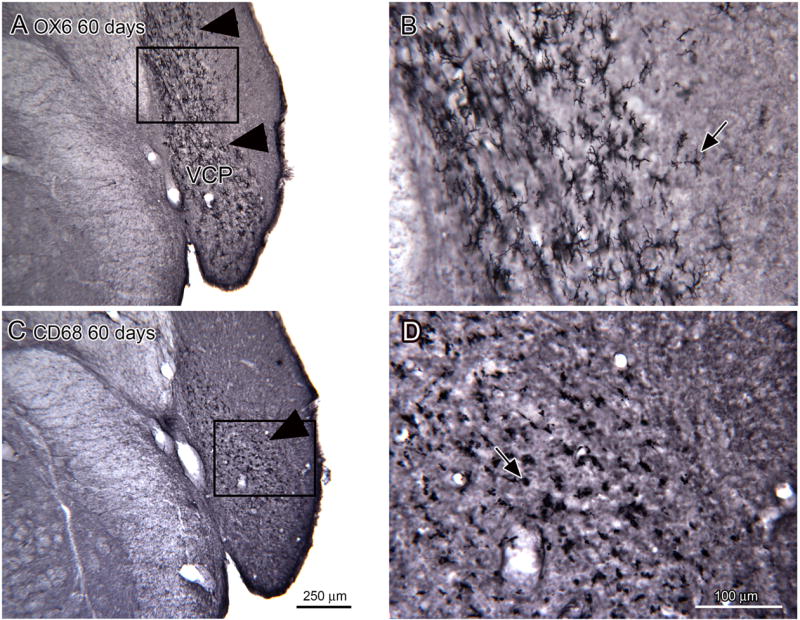
Comparison of OX6 and CD68 immunostaining in the CN of 60 day survival animals. A. Arrowheads show the region of dense OX6 expression in the VCP (bregma -11.723). The rectangle shows the location of the image in B. Shapes of OX6-ir elements. The arrow shows an example of a well-stained cell. C. More limited region of CD68 expression (arrow) in the VCP (bregma -11.723). The rectangle shows the location of the image in D. Scale bar also for A. D. The arrow (D) shows a CD68 immunostained cell with a round soma and no stained processes. Scale bar also for B.