
Figure 2.
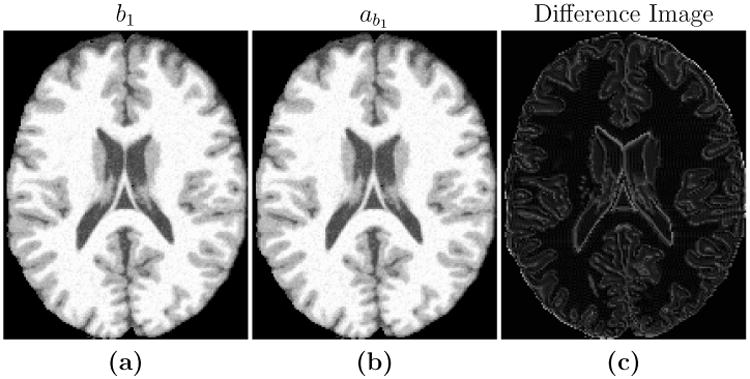
Shown are (a) an SPGR image (TR = 18 ms, TE = 10 ms, α= 45° with 0% additive noise) which we use as our subject image b1, the maximum intensity value is 1080, the (b) new atlas image, ab1, with pulse sequence parameters estimated from b1, and (c) the difference image |ab1 − b1|, the maximum value is 5.