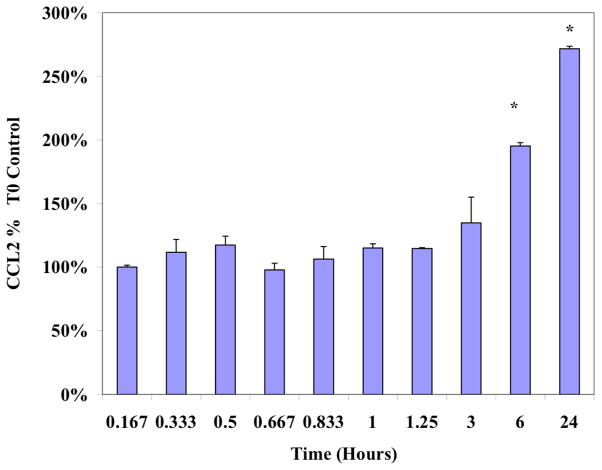
Figure 1. Time course of the TNFα-dependent accumulation of CCL2 in MDA-MB-231 cells.
MDA-MB-231 cells were exposed to sublethal levels of TNFα (40ng/ml) and CCL2 release was monitored as described in Materials and Methods. The data is presented as % Ctrl at Timezero, displayed as the Mean ± S.E.M., n=4. Differences from Control were determined using a determined by a one-way ANOVA, with a Tukey post hoc test. *p<0.05.

