Figure 4.
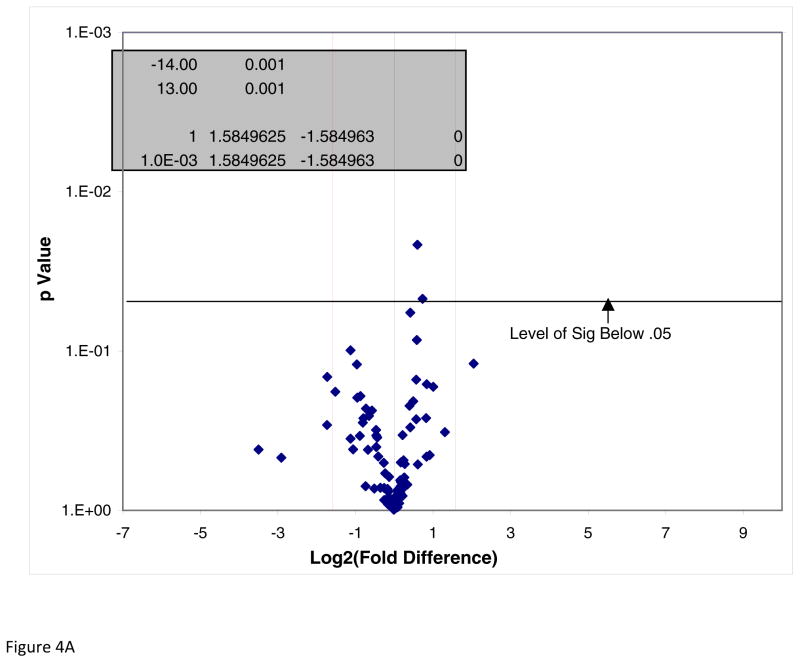
Figure 4A. NFκB Signaling Pathway RT2 Profiler™ PCR Array of DADS vs Control. Effect of DADS vs control in MDA-MB-231 cells, displayed on a volcano plot showing significance, fold change and direction. There were no significant differences found between these groups at p<0.05.
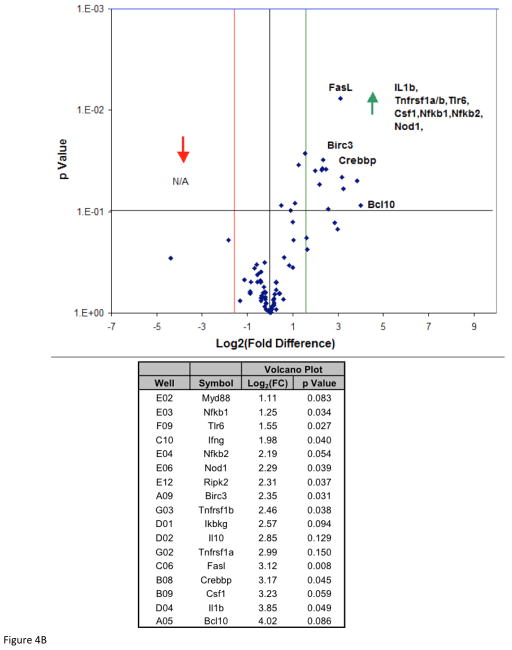
Figure 4B. NFκB Signaling Pathway RT2 Profiler™ PCR Array of TNFα vs control. Analysis of TNFα vs control displayed on a volcano plot showing significance, fold change and direction. Transcriptome upward directional shifts (A), with significance and Log2 (Fold Change) listed along official gene symbols (B).
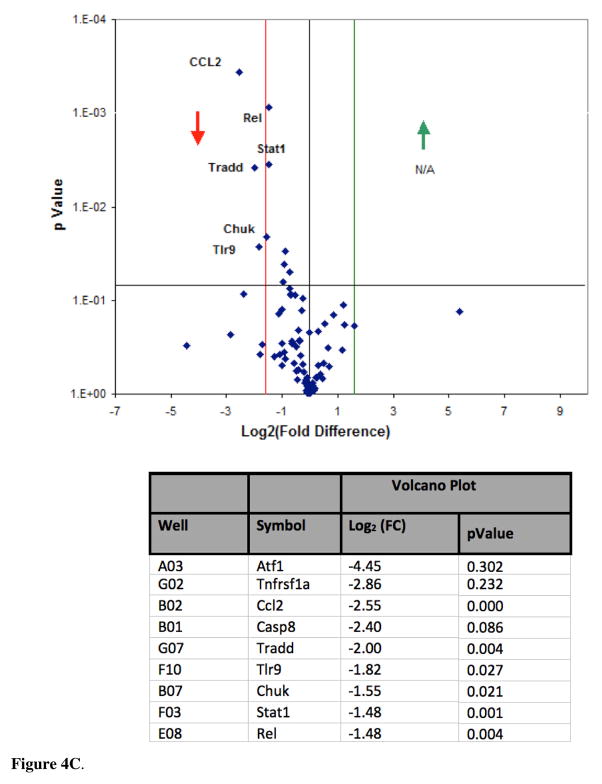
Figure 4C. NFκB Signaling Pathway RT2 Profiler™ PCR Array of TNFα vs TNFα/DADS. Effect of TNFα vs TNFα/DADS on gene expression: displayed on a volcano plot showing significance, fold change and direction. There were significant differences found between these groups using the PCR Array PAMM – 025Z in the downward direction (A), with significance and Log2 (Fold Change) listed along official gene symbols (B).


