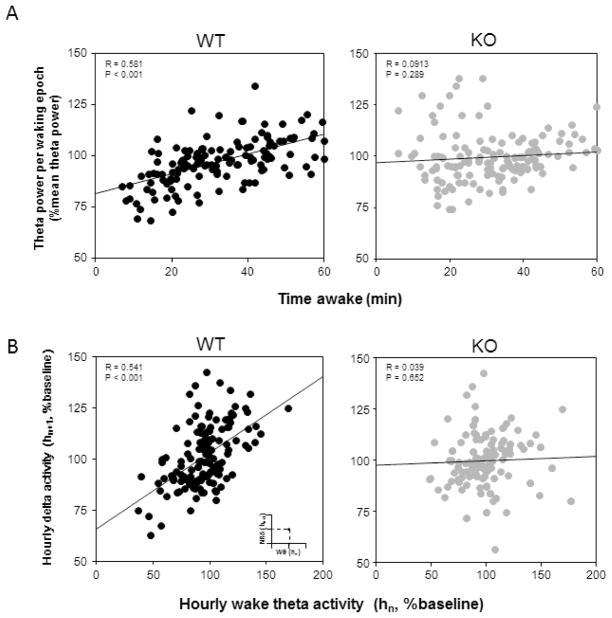
Figure 2.
Correlation of EEG parameters during spontaneous sleep-wake cycle in WT and ENT1 KO mice. A, Scatter plot of time awake in minute(s) and normalized theta power per waking epoch for the same time bin during a 24-hour sleep-wake cycle shows significant correlation in WT (black) but not in KO mice. B, Wake theta activity (Wθ) of each hour (hn, n=1 to 23) is plotted against NREM delta activity (NRδ) for the following hour (hn+1) (see inset). In WT mice (N=6, black dots) a significant linear correlation was observed but not in the KO (N=6, grey dots) mice. Theta and delta power are normalized to 24-hour mean theta and delta power, respectively. R, Pearson’s correlation coefficient; P, probability.

