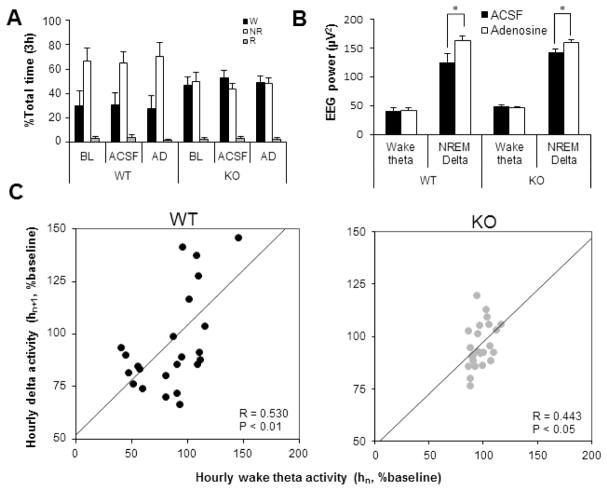
Figure 3.
Sleep-wake profiles and EEG power changes during 100 μM adenosine perfusion for three hours during light period. A, Time spent in wake (black), NREM (white) and REM (grey) sleep was not significantly different during three conditions: baseline, ACSF and adenosine (AD) perfusion. B, Comparison of wake-theta (Wθ) and NREM delta activity between ASCF and AD perfusion for 3 hours from 7AM to 10AM. *P<0.05 by paired t-test. C, The scatter plot of normalized Wθ activity of each hour (hn, n=1 to 2) against normalized NRδ in the following hour (hn+1) during AD perfusion. A significant linear trend line is restored in KO mice (grey dots) by AD perfusion similar to that observed in WT (black dots) mice. R, Pearson’s correlation coefficient; P, probability.

