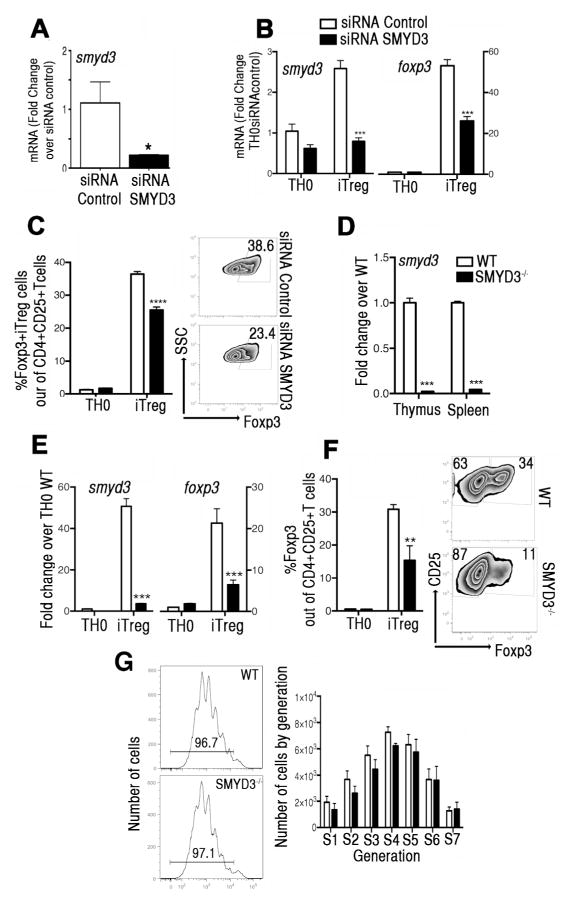
Figure 4. SMYD3 depletion inhibits Foxp3 expression during Treg cell development.
(A) Naïve CD4+T cells, transfected with SMYD3 or control siRNA, were assessed for smyd3 expression. (B) After 5 days, expression levels of smyd3 and foxp3 were assessed in transfected cells under TH0 or iTreg skewing conditions. (C) Bar graphs and zebra plots showing Foxp3 expression in gated CD4+CD25+ T cells. Data are presented as the mean of four wells and are representative of four independent experiments. (D) Expression levels of smyd3 mRNA in CD4+T cells derived from thymus and spleens of WT and SMYD3−/− mice. (E) Expression levels of smyd3 and foxp3 mRNA in naïve CD4+T cells from WT (white) and SMYD3−/− (black) differentiated under TH0 and iTreg skewing conditions for 3 days. (F) Bar graphs of CD4+CD25+T cells from WT (white) and SMYD3−/− mice (black) and zebra plots showing Foxp3 expression in gated CD4+CD25+T cells skewed as in E. (G) CFSE-labeled naïve CD4+T cells derived from WT and SMYD3−/− mice under iTreg skewing conditions were assessed by flow cytometry. Histogram plots show proliferation and bar graph shows number of proliferating cells by generation at day 4. Data are representative of 4 independent experiments performed with n=3 per group and show means ± SEM of 4 replicates. *P<0.05, **P<0.01, ***P<0.001.

