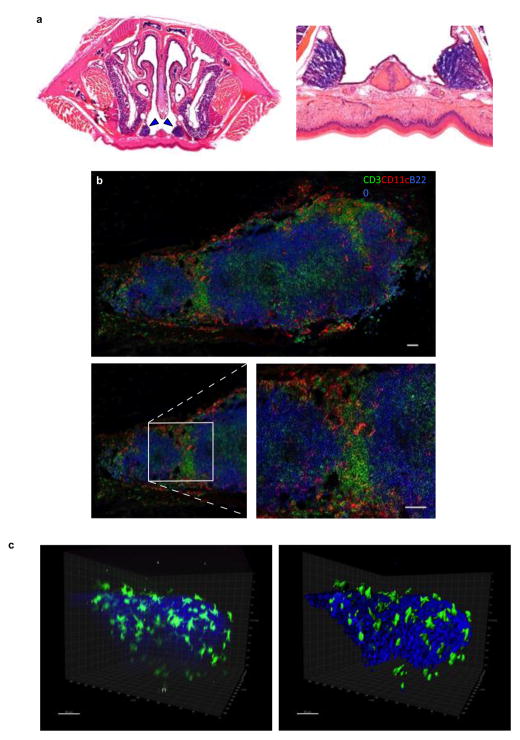
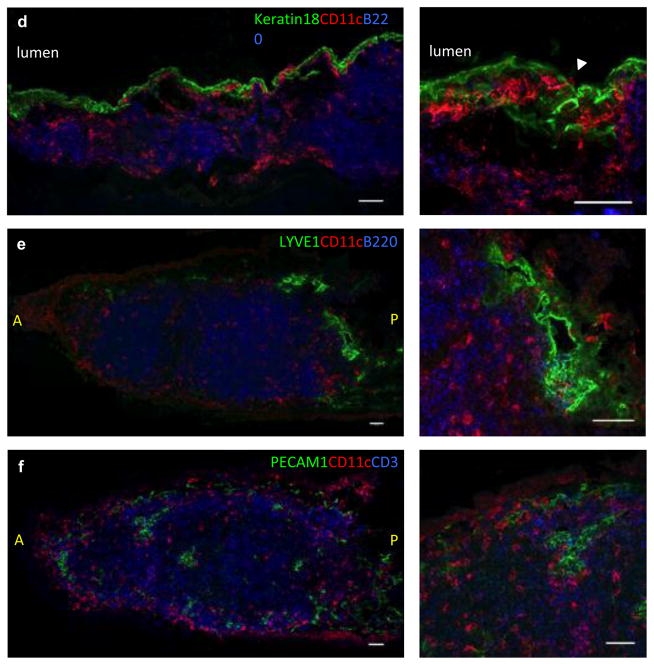
Figure 1. DCs in murine nasal-associated lymphoid tissue (NALT).
(a) Hematoxylin and Eosin (H&E) staining was used to define the morphology of murine NALT (indicated with blue arrowheads) at 200x magnification (left) and at 400x magnification (right) (b) Immunofluorescent staining to define the relationship of NALT associated dendritic cells (DC) with T and B cells. Confocal micrograph of the entire longitudinal section of NALT is depicted here by combining individual images in Adobe Photoshop CC. CD3+ T cells (green), B220+ B cells (blue), and CD11c+ cells (red) are shown. Inset highlights a magnified area demonstrating that the CD11c+ cells are predominantly located in the T cells zones and in the periphery of the NALT. Each figure is representative of at least five experiments. Bars, 50μm. (c) Three dimensional reconstruction from two-photon microscopy data showing spatial distribution of nasal CD11c+ cells (green) from eYFP transgenic mice and collagen second harmonic generation (blue). Raw fluorescent image (left) and reconstructed image (right) are depicted. (d,e,f) Immunofluorescent staining to define the relationship of NALT DCs with the nasal epithelium, blood vessels and lymphatic channels. (d) Shows the relationship of CD11c+ cells (red) with the cytokeratin 18+ nasal epithelial cells (green) and B220+ B cells (blue). White arrowhead shows the extension of CD11c+ dendrites across the epithelium into the nasal lumen. (e) Depicts the relationship of CD11c+ cells (red) with LYVE1+ lymphatic channels (green) and B220+ B cells (blue) and (f) shows the proximity of CD11c+ cells (red) to PECAM1+ blood vessels (green) and B220+ B cells (blue). In panels d, e and f, confocal micrographs of the entire longitudinal section of NALT are depicted by combining individual images in Adobe Photoshop CC. A= Anterior, P=Posterior. Each figure is representative of at least three experiments. Bars, 50μm.


