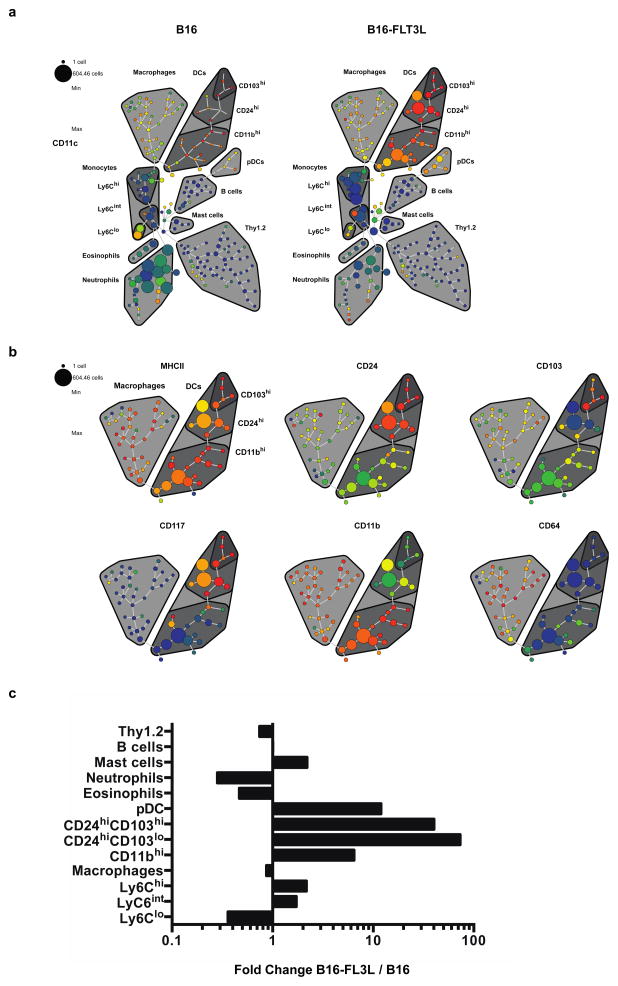
Figure 4. CYTOF plots comparing nasal populations in B16 melanoma and FLT3L-B16 melanoma mice.
(a) SPADE plots showing the expression of CD11c in nasal mononuclear cell populations as indicated. (b) Macrophage and DC focused spade trees showing the expression of the indicated markers in FLT3L treated mice. The size of each node represents the number of cells and the strength of expression of the respective marker is indicated by the color as specified in the legend (c) Summary of the CYTOF data showing fold changes in the respective populations, comparing nasal populations in B16 and B16- FLT3L mice.

