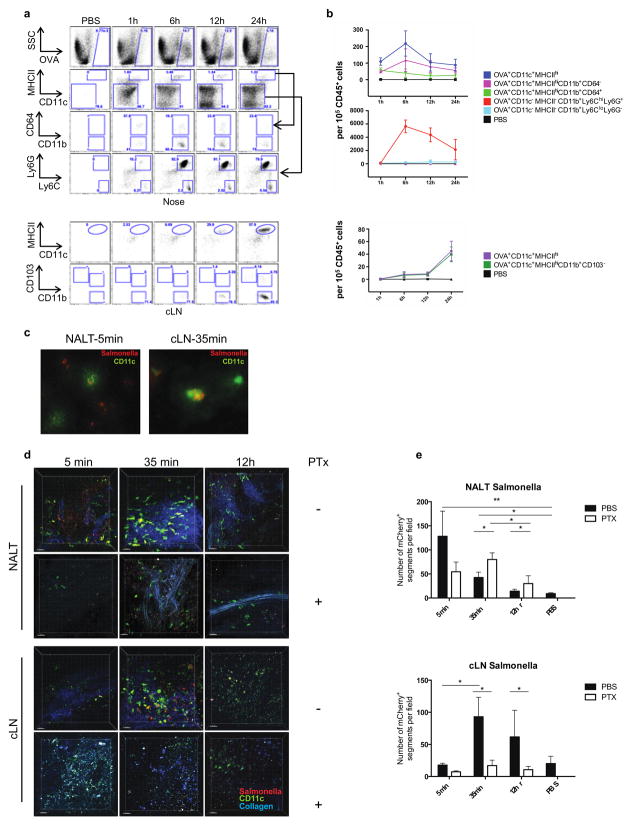
Figure 7. Migration of nasal DCs to cervical draining LNs.
(a,b) Targeting of nasal DCs and Neutrophils following intranasal administration of OVA-Alexa 488 and migration of OVA+ DCs to the cervical lymph nodes. (a,b) At least three WT mice per time point were administered either OVA Alexa 488 plus LPS or were given PBS intranasally and analyzed at 1h, 6h, 12h, and 24h. (a) (Top) Shows representative flow cytometric analysis of OVA+ cells. Both nasal DCs (CD11c+MHCII+CD11b+CD64− cells) and neutrophils (CD11c−MHCII−Ly6ChiLy6Ghi cells) are shown. (Bottom) Shows representative flow cytometric analysis of OVA+ migratory DCs (CD11c+MHCIIhi cells) in the cLN at respective time points. (b) Cumulative data from three individual experiments is quantified here. Error bars = SD. (c) Three-dimensional reconstruction from two-photon microscopy data showed dramatic change in spatial distribution of CD11c-eYFP+ DCs (green) and mCherry expressing salmonella (red) between NALT and cervical lymph nodes (cLN). Second-harmonics signals from collagen are in blue. Scale bars, 30μm. (d) Numbers of mCherry+ cells in NALT (top) and cLN (bottom) were quantified using the Imaris software (Bitplane). Each figure is representative of at least three experiments. Error bars = SD. 400x magnification. (e) Uptake of Salmonella typhimurium by CD11c-eYFP+ cells derived from the murine nose and mediastinal lymph node is compared between PBS and PTX administered mice at 5 min, 35 min and 12h post administration using two-photon microscopy.

