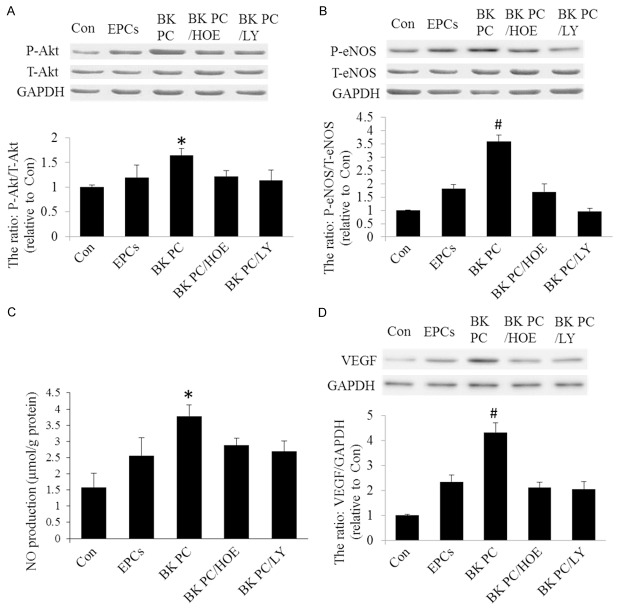
Figure 4.
Effects of BK-PC-hEPC transplantation on Akt, eNOS, VEGF expression, as well as NO production. A and B. Western blots analysis to identify Akt and eNOS expressions. C. NO production in myocardial tissue. D. Western blot analysis for VEGF expression. Representative blots are shown in the upper panel, and densitometric quantitation of protein expression levels are shown as fold changes in the lower panel. All values are expressed as mean ± SEM (n = 5 for each group; *P < 0.05 versus other myocardial infarction groups; #P < 0.01 versus other myocardial infarction groups).

