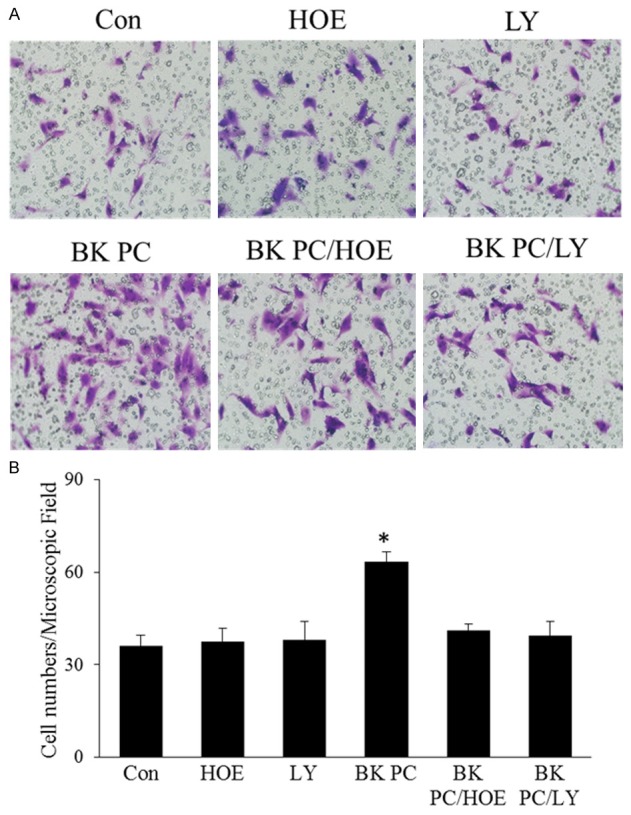
Figure 5.

Effect of BK preconditioning on the migration of hEPCs. A. Representative photographs of the migrating hEPCs in the presence of 100 ng/mL SDF-1 stimulation among the six groups (original magnification: 200 ×). B. Quantitative analyses of the migrating hEPCs. All values are expressed as mean ± SEM. (n = 5 for each group; *P < 0.01 versus other groups).
