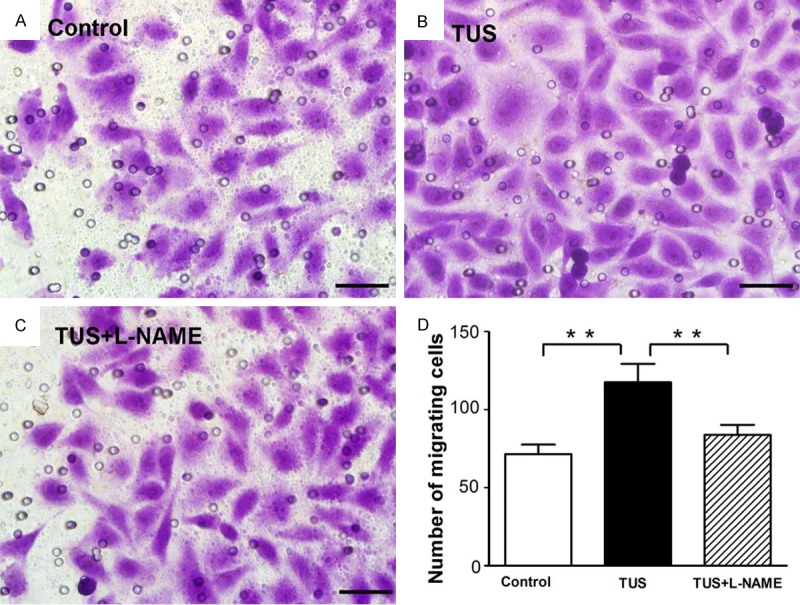
Figure 3.

TUS effect on migration of HUVECs. Effect of TUS treatment on the migratory potential of HUVEC was examined using Transwell migration chambers as detailed in ‘Materials and Methods’. Control group (A), TUS group (B), and TUS+L-NAME group (C) were photographed at 200 x magnification. (D) Result depicted that TUS caused an obviously increase in cell migration which was blocked by L-NAME treatment. Values are mean ± SEM; n = 5, ** means p < 0.01. Scale bars = 100 μm.
