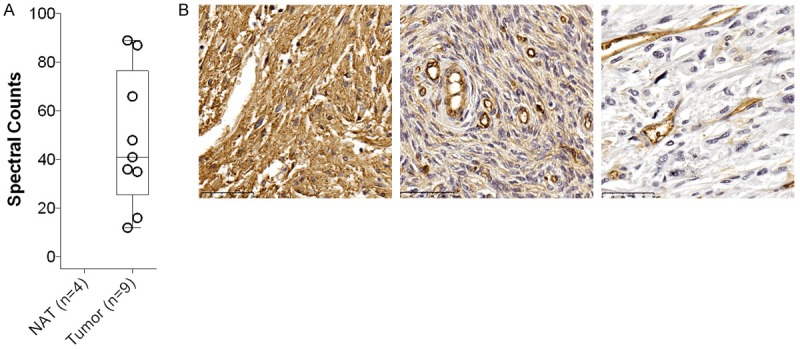
Figure 1.

Overexpression of CD39 in Sarcoma. A. Mass-spectrometric analysis identifies CD39 expression in primary sarcoma samples, but not in non-involved adjacent tissue. B. Representative staining for CD39 on STS. Fibrosarcoma in the peritoneum with IHC score +3 (left panel), fibrosarcoma in the abdominal wall with IHC score +1 (middle panel), CD39-negative normal stroma (right panel). Please note that vasculature is CD39 positive and represents an internal control for all tissue sections. NAT, non-involved adjacent tissue; Scale bar = 50 microns.
