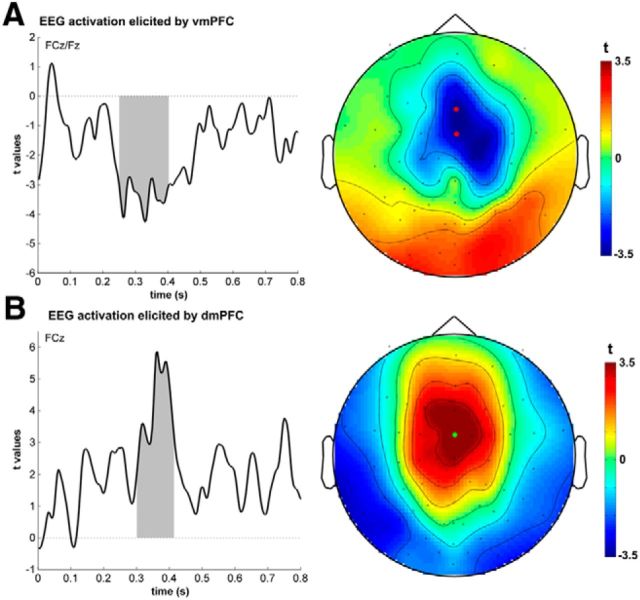
Figure 5.
Time course of vmPFC and dmPFC uncorrected for other areas. In our main analysis, we investigated the unique contributions of dmPFC and vmPFC. To investigate the effect of dmPFC and vmPFC when not controlling for the contributions of the related areas, we analyzed the vmPFC and dmPFC separately. We found that both signals show sustained activations after feedback with a similar topography as in our main analysis. This supports an assumption that activation signals recorded during this time consist of a mixture of dmPFC and vmPFC signals and are not differentiable by using common EEG/MEG analyses. dmPFC (B) showed a sustained activation from ∼300 to 420 ms (shaded area depicts cluster-corrected significance) and vmPFC (A) activity peaked at 260 ms after feedback and showed a long lasting activity again until ∼400 ms.

