
Figure 1.
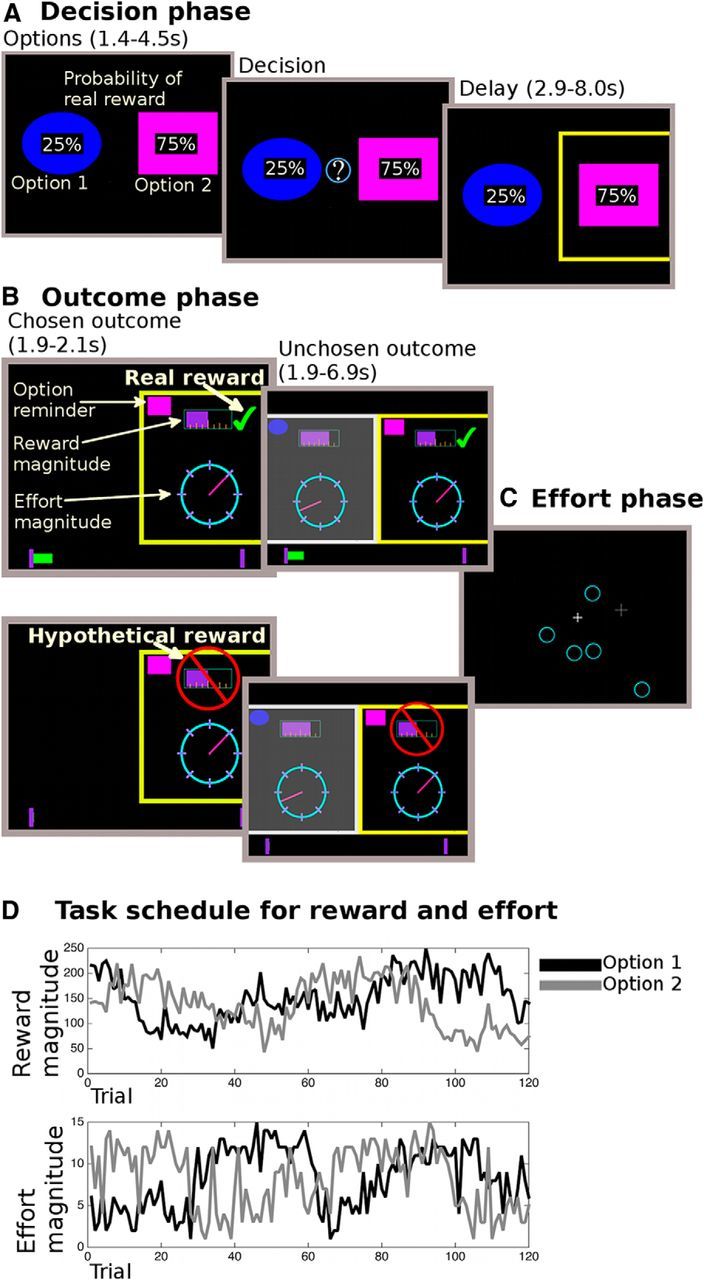
Task description. A, In the decision phase, participants were shown two options (i.e., choices), overlaid with the probability of receiving a reward for each choice. They could only decide after an initial monitoring phase (1.4–4.5 s). The chosen option was then highlighted for 2.9–8 s. B, In the following outcome phase, participants saw the outcome for the chosen option first (1.9–2.1 s). The reward magnitude was shown as a purple bar (top of the screen); the effort magnitude was indicated through the position of a dial on a circle. Whether they received a reward was indicated by a tick mark (real reward, top display) or a red crossed-out sign over the reward magnitude (hypothetical reward, bottom display). If a reward was real, the reward was also added to a status bar at the bottom of the screen, which tracked rewards over the course of the experiment. A reminder of what option they had chosen was shown at the top of the screen. Then the reward and effort magnitudes were shown for the unchosen option (1.9–6.9 s). Finally, participants performed the effort phase (C) where the number of targets was equivalent to the chosen effort outcome. Importantly, participants had to perform the effort phase on every trial, independent of whether the reward was real or hypothetical. An example schedule is shown in D, with both the reward and effort magnitude values of the two choices.