Figure 4.

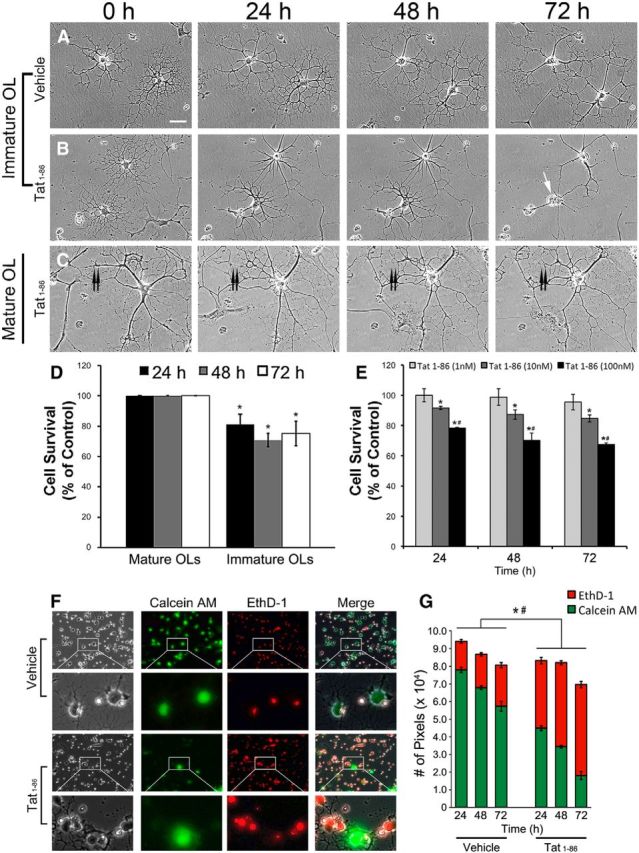
Survival of Tat-treated OLs. A–C, Sample images of OL cultures treated with vehicle or Tat (100 nm) after 0, 24, 48, and 72 h. A, Immature OLs treated with vehicle grow normally and differentiate over the 72 h period. At the end of 72 h, cells have complex process networks with myelin-like membranes (Scale bar, 100 μm). B, Immature OLs treated with 100 nm Tat. Both OLs in the field were healthy at 0 h. One OL was dead after 72 h (white arrow). Although the other OL survived, its process network was greatly reduced. An astrocyte at the lower right corner migrated out of the field by 24 h. C, A mature OL treated with 100 nm Tat appeared healthy and still maintained a complex process network after 72 h, even though it underwent extensive process reorganization. The double arrow marks a major process that was retracted. D, OL vulnerability to Tat was dependent on differentiation. Almost all mature OLs (>95%) survived for the 72 h experimental period, whether they were treated with vehicle or 100 nm Tat. In contrast, survival of immature OLs was significantly reduced by 100 nm Tat, even at 24 h. (*p < 0.05 vs immature OL controls; 1-way ANOVA followed by post hoc Bonferroni's test; n = 4 individual experiments; ≥25 cells were counted for each n). E, Concentration-dependent effect of Tat on immature OL survival. Immature OLs at day 2 were treated with 1, 10, and 100 nm Tat for 24, 48, and 72 h. Tat (1 nM) shows no obvious effect on OL survival, while 10 nm Tat reduces survival by 10–15% when compared with controls at 24, 48, and 72 h. The cytotoxic effect of 100 nm Tat is even more significant (22–35% reduction in survival; *p < 0.05 vs control; #p < 0.05 vs 10 nm Tat group; 2-way ANOVA followed by post hoc Bonferroni's test; n = 4 individual experiments; >40 cells were counted for each n). F, G, The live–dead assay shows that 100 nm Tat significantly increased immature OL death at 24, 48, and 72 h. F, Corresponding phase and fluorescent images of calcein-AM-labeled (live cells, green) and EthD-1-labeled (dead cells, red) day 2 immature OLs treated with vehicle or 100 nm Tat for 72 h. The majority of cells in the cultures appeared to shift from green to red with Tat treatment. G, At all time points, 100 nm Tat significantly increased the proportion of red pixels and reduced numbers of green pixels, indicating less OL survival with Tat and validating the visual observation in F (*p < 0.05 number of red pixels; Tat vs control of same time point; #p < 0.05, number of green pixels; Tat vs control of same time point; 1-way ANOVA followed by post hoc Bonferroni's test; n = 4 individual experiments; 20 randomly selected images were analyzed for each n).
