Figure 1.

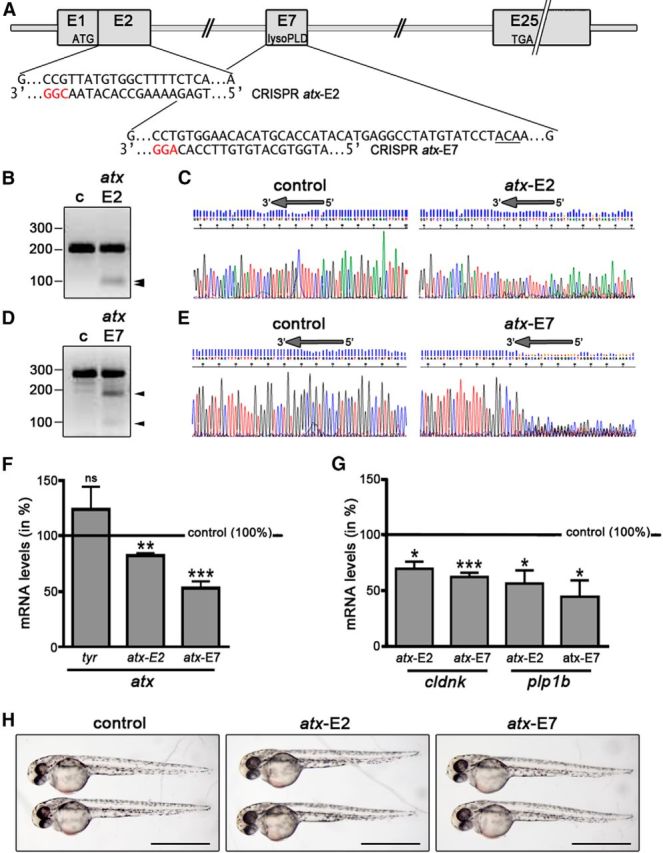
In the developing zebrafish, CRISPR/Cas9-mediated mutagenesis of atx leads to a reduction in the mRNA levels for OLG marker genes. A, atx (enpp2) genomic structure and CRISPR target sequences. ATG and TGA indicate the locations of the translation start and stop sites. Protospacer adjacent motif sequences are highlighted in red. The sequence encoding T210, the threonine residue shown to be obligatory for the enzymatic activity of ATX, is underlined. B, D, Representative images of agarose gels showing DNA fragments subsequent to Surveyor nuclease treatment of control homoduplexes (c) and control/atx-E2 (B) or control/atx-E7 (D) homo/heteroduplexes. Numbers on the left indicate DNA sizes in base pairs. Arrowheads indicate cleaved PCR amplicon fragments at the expected sizes indicative of indel mutations generated by genome editing. C, E, Representative images of sequencing traces obtained from genomic DNA-derived PCR amplicons from control and Cas9 mRNA/sgRNA injected zebrafish embryos. Arrows at the top of each trace indicate the location of the target sequence, over and upstream of which a composite sequence trace indicates the presence of indel mutations generated by genome editing. F, G, Bar graphs illustrating mRNA levels for atx (F) or the OLG marker genes cldnk and plp1b (G) in whole embryos at 48 hpf and as determined by real-time RT-qPCR analysis. Control (uninjected embryos) values were set to 100% (see horizontal line) and experimental values were calculated accordingly. Data shown represent means ± SEM. ns, Not significant; *p ≤ 0.05, **p ≤ 0.01, ***p ≤ 0.001. H, Representative bright-field images of control (uninjected) and Cas9 mRNA/sgRNA injected embryos at 48 hpf. Scale bars, 1 mm.
