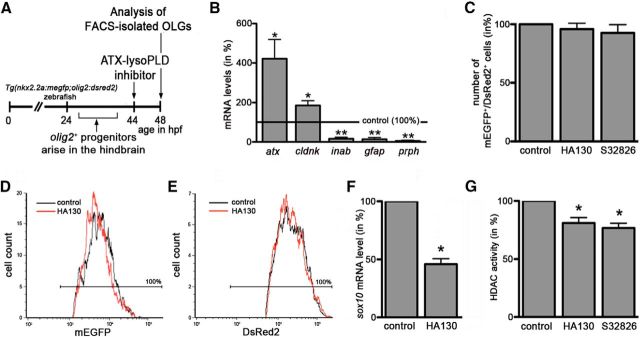
Figure 4.
In the developing zebrafish, inhibition of the lysoPLD activity of ATX during early stages of OLG differentiation leads to a reduction in HDAC activity within cells of the OLG lineage. A, Experimental design using Tg(nkx2.2a:megfp;olig2:dsred2) zebrafish embryos, which were treated with the ATX–lysoPLD inhibitors HA130 (10 μm) or S32826 (10 μm) at a time point when newly specified OLG progenitors start to differentiate. B, Bar graph illustrating the mRNA expression profile under control conditions for FACS-isolated mEGFP/DsRed2 double-positive cells as determined by real-time RT-qPCR analysis. mRNA levels in whole fish were set to 100% for each gene individually (marked by the horizontal line), and the values for sorted cells were calculated accordingly. C, Bar graph showing the number of mEGFP/DsRed2 double-positive cells as determined by FACS analysis. Values for vehicle-treated embryos were set to 100% (see control bar), and experimental values were calculated accordingly. D, E, Representative single-parameter fluorescence histograms (x-axis: fluorescence intensity, logarithmic scale; y-axis: cell number) depicting mEGFP (D) or DsRed2 (E) intensities of mEGFP/DsRed2 double-positive cells under control conditions (black line) and after treatment with HA130 (red line). Cells within the area marked by the horizontal line were considered mEGFP (D) or DsRed2 (E) positive. Note the high purity (100%) of the sorted cell population. F, Bar graph depicting sox10 mRNA levels for FACS-isolated mEGFP/DsRed2 double-positive cells as determined by real-time RT-qPCR analysis. Values for vehicle-treated embryos were set to 100% (see control bar), and experimental values were calculated accordingly. G, Bar graph depicting HDAC activity as determined by using the fluorogenic substrate Boc-Lys(Ac)-AMC. Values for vehicle-treated embryos were set to 100% (see control bar), and experimental values were calculated accordingly. Data shown in all bar graphs represent means ± SEMs. *p ≤ 0.05, **p ≤ 0.01.

