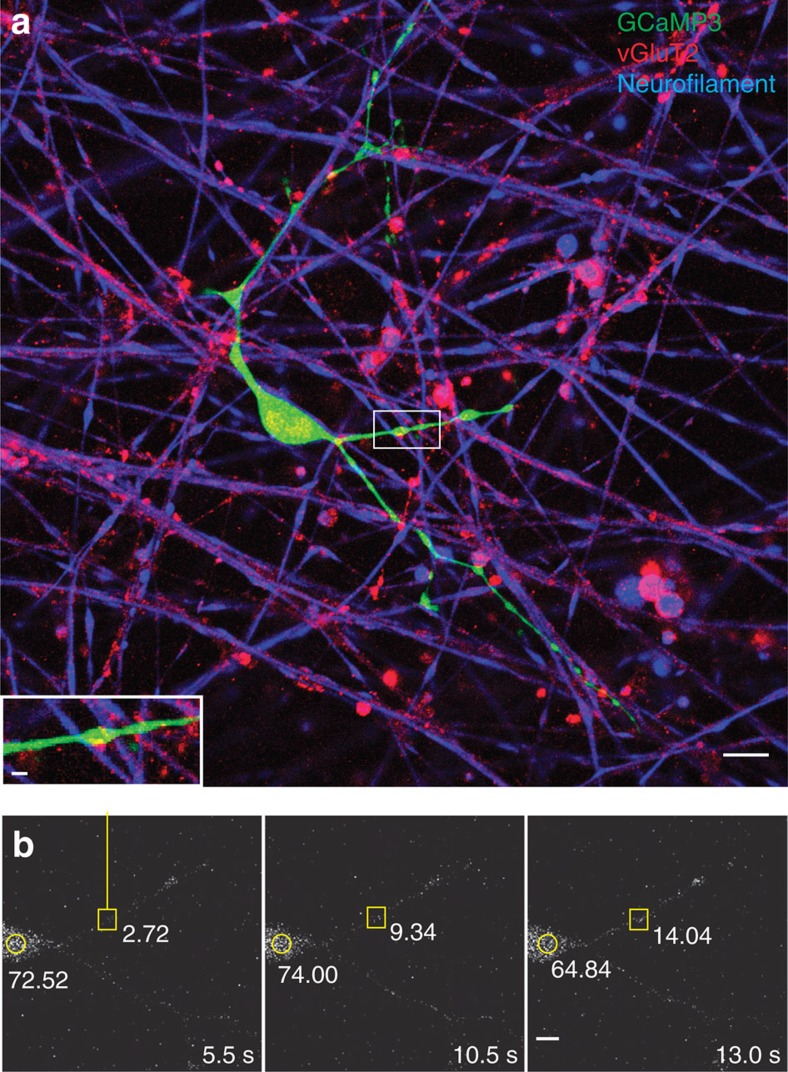
Figure 3. Ca2+ increases in processes of OPCs at axonal varicosities.
(a) OPC processes (green, GCaMP3 transfection) form specialized functional junctions with DRG axons (blue, neurofilament), containing accumulations of synaptic vesicles containing glutamate (red, vGluT2). Scale bar, 10 μm. After live-cell calcium imaging (b), the cultures were fixed and stained by immunocytochemistry to determine whether that the calcium responses were associated with axo-glial contacts containing glutamatergic synaptic vesicles (inset in a). Note colocalization between axonal varicosity (red, vGluT2) and swellings in OPC process (green, GCaMP3). Scale bar, 2 μm. (b) Time-lapse series showing a local increase in Ca2+ in OPC-axon junctions in response to electrical stimulation of axons. A stimulus-induced, local increase in Ca2+ in the same axo-glial junction (yellow square) that is shown in a is recorded in the OPC transfected with GCaMP3. Time since stimulus onset is shown in each frame (5.5–13 s). The fluorescence intensities at the axo-glial contact (yellow square) and the OPC cell body (yellow circle) are shown. Note the local increase in fluorescence intensity at the axo-glial junction after stimulation but this is not accompanied by an increase in fluorescence intensity in the soma. Scale bar, 5 μm.

