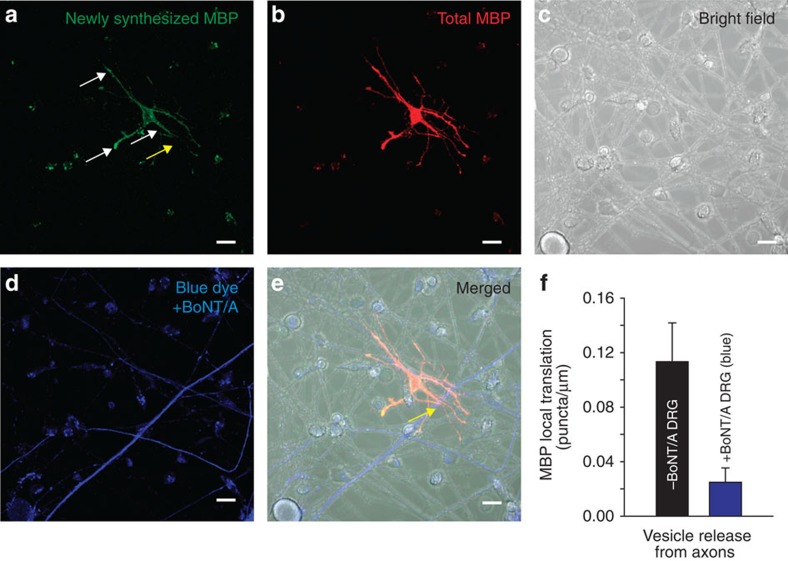
Figure 7. Local translation of MBP occurs preferentially on OPC processes contacting electrically active axons releasing synaptic vesicles.
(a) Newly synthesized MBP (green). Axons were stimulated electrically at 10 Hz for 10 min and local translation of MBP was monitored using kikume MBP fluorescence after 40 min. White arrows indicate new MBP translation in contrast yellow arrow showing no new MBP translation. (b) Total MBP (red). (c) Bright field showing cell morphology of co-culture. (d) Axons treated previously with BoNT/A to block synaptic vesicle release (blue). (e) Combined images from a–d. Differential interference contrast and fluorescence to identify axons treated (blue, yellow arrow) and not treated with BoNT/A. Yellow arrow shows axon and OPC interaction without MBP translation (notice yellow arrow in a with lack of new MBP green puncta indicating no new MBP translation). (f) Quantification shows significantly more local translation of MBP in OPC processes that were in contact with axons releasing synaptic vesicles (grey axons) (0.11±0.024 versus 0.028±0.011 puncta per micrometre length of axon not treated or previously treated with BoNT/A respectively, P<0.001, t-test, n=24 cells from non-blue, n=23 cells from blue axons, five dishes). Scale bar, 10 μm.

