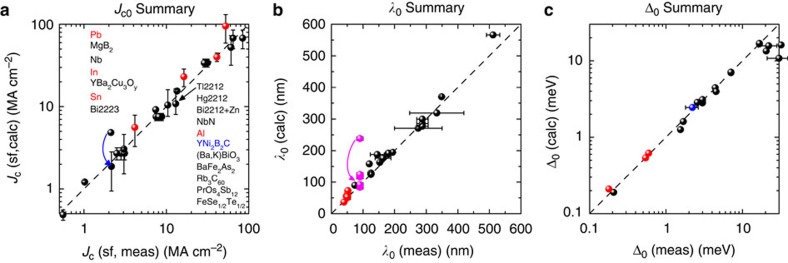
Figure 2. Summary comparison of calculated and measured values.
(a) Comparison of calculated thin-film self-field Jc0 values with measured Jc0 values. Jc0 is calculated from reported λ values using equations (3) and (4). Red data points are type-I superconductors, black data points are type II. The blue arrow for YNi2B2C shows the effect of the correction factor (λ/b)tanh(b/λ), discussed in the text, when b>λ. Error bars reflect the range of reported λ0 values—see Supplementary Table 1. The sample annotation follows the vertical order of the data points. (b) λ0 values calculated from reported Jc(T) data and plotted versus independently measured λ0 values. The magenta arrow and symbols show the effect of improvement over time in self-field Jc for six films of MgB2. The data terminates on the dashed line where Jc is now fundamentally limited by the superfluid density. Comparative data for YBCO over time is shown in Supplementary Figure 4. (c) Summary of values of Δ0 calculated from the low-T behaviour of λ(T) using equations (6) and (7), plotted versus measured values of Δ0.

