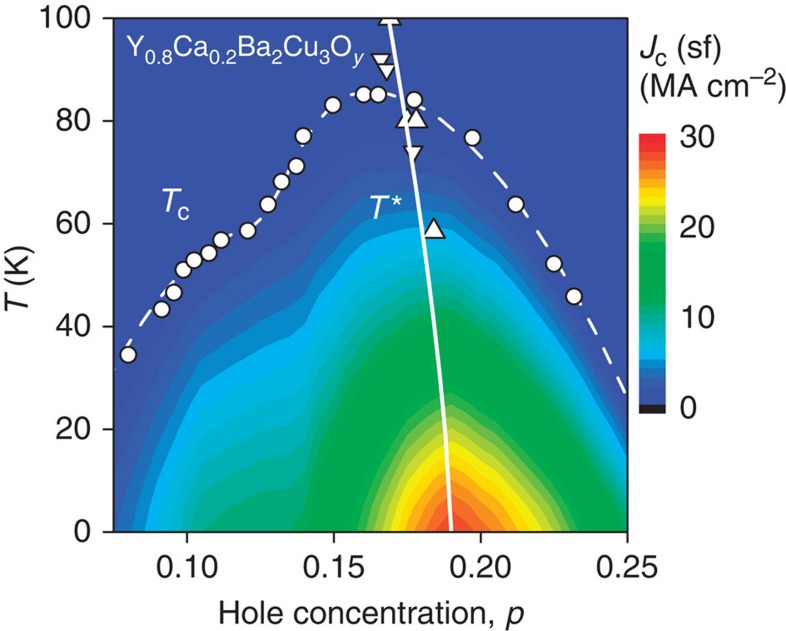
Figure 4. Predicted Jc across the YBCO phase diagram.
Map of Jc(sf) across the phase diagram for Y0.8Ca0.2Ba2Cu3Oy calculated from the superfluid density23,24 using equation (4). A sharp peak is centred on the critical doping where the pseudogap T* line falls to zero (solid white curve). The triangles show the low-T data points for T* reported from field-dependent resistivity29. A second smaller peak is predicted just below P≈0.12 where charge ordering has been reported33. The circles are Tc data points.

