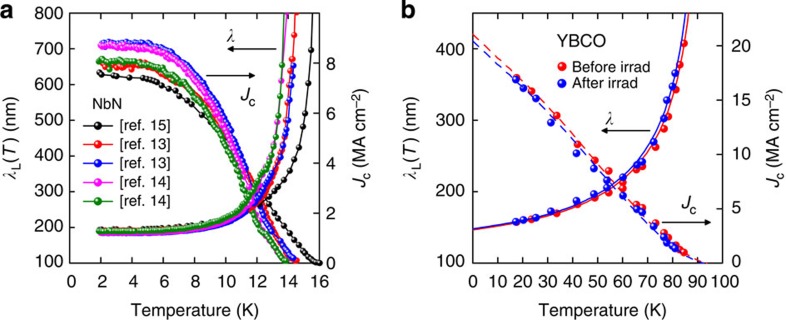
Figure 5. Thickness and irradiation dependence of Jc.
The T-dependence of Jc(sf) and λ calculated from equation (4) for thin films of (a) NbN with different thicknesses, b=4 nm (refs 13, 14) and 11 nm (ref. 15) and different bridge widths. (b) YBCO before and after ‘nano-dot' irradiation45. The solid red and blue curves are weak-coupling d-wave fits to the calculated λ(T) data, before and after irradiation, respectively. The red and blue dashed curves are the respective back-calculated Jc(T) curves from these d-wave fits. Note in a the small variation in λ0 despite the quite large variation in Jc, and λ0 is evidently independent of b when b<λ. Values of Δ0=2.95±0.02 meV obtained from fitting the low-T behavior of λ(T) also reveal little variation. In b, Jc(sf) and λ are independent of irradiation despite the large increase in pinning evidenced by a 60% increase in Jc(T, H) above 1 Tesla.

