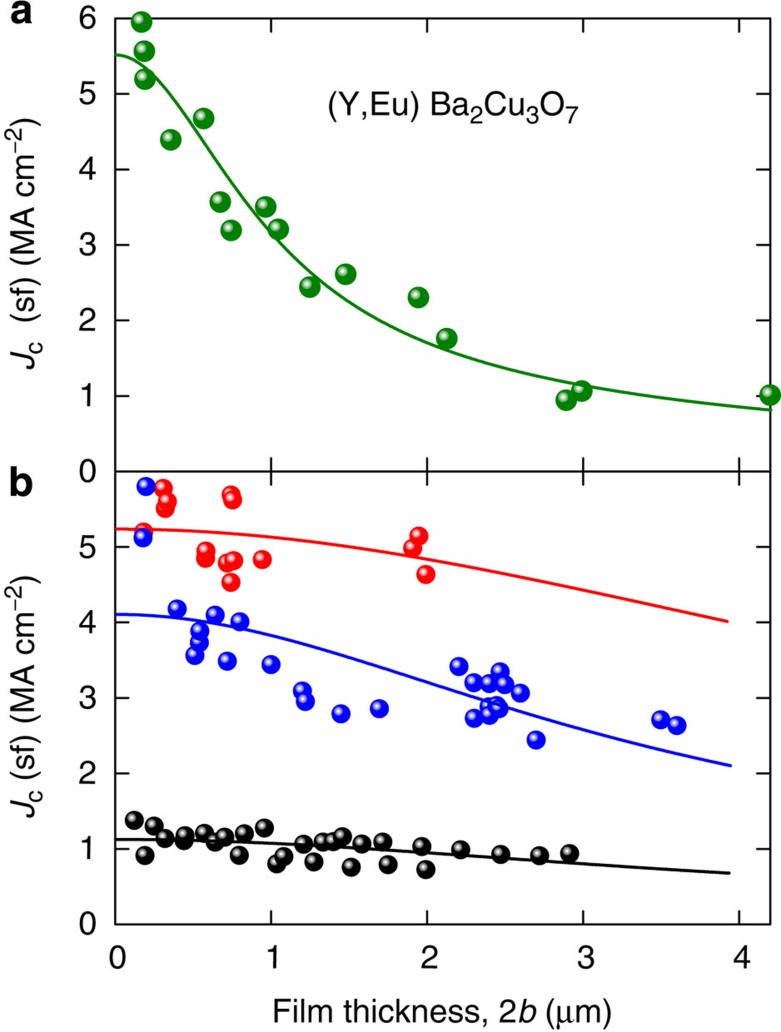
Figure 6. Thickness dependence of Jc for YBCO.
Jc(sf) for epitaxial YBCO films versus film thickness. (a) (Y0.67Eu0.33)Ba2Cu3O7–δ at T=75.5 K, from Zhou et al.40 The solid curve is equation (12) with λc=620 nm. This value is too low and reflects increasingly non-uniform composition and microstructure across the thickness. (b) YBCO systems with a highly uniform through-thickness microstructure: Feldmann et al.42 (black data points and curve), with λab(77)=339±5 nm and λc(77)=1,153±238 nm progressively thinned by ion milling; Zhou et al.43 (blue data points and curve) gives λab(75.6)=253±4 nm and λc(75.6)=1,063±28 nm; Feldmann et al.44 (red data points and curve) gives λab(75.6)=233±2 nm and λc(75.6)=1,980±790 nm.

