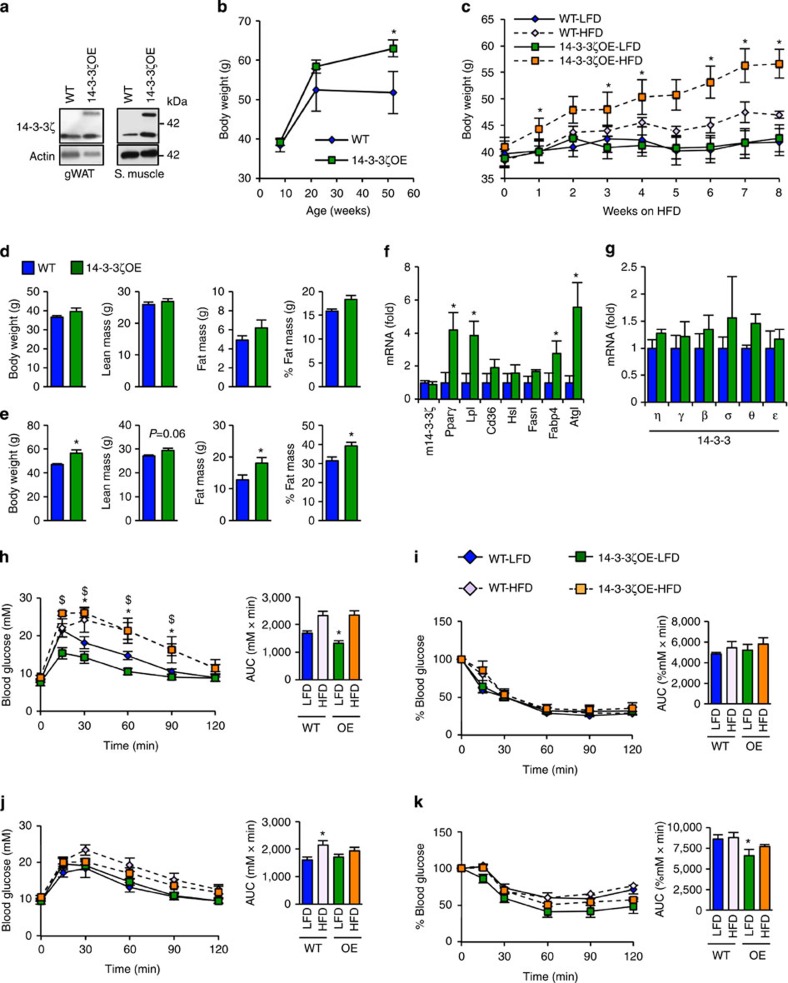
Figure 2. Overexpression of 14-3-3ζ is sufficient for age-associated and high-fat diet-associated weight gain.
(a) Expression of the TAP-tagged 14-3-3ζ (50 kDa) and endogenous 14-3-3ζ (30 kDa) in gonadal white adipose tissue (gWAT) and skeletal muscle (n=3 per group). (b) Body weights of WT and 14-3-3ζ-over-expressing transgenic (14-3-3ζOE) mice were measured for 1 year (n=4–9 per group; *P<0.05, assessed by Student's t-test). (c) Weekly body weights of 12 week old WT and 14-3-3ζOE mice fed a high-fat diet (HFD, 60% fat) or the corresponding control diet (LFD, 10% fat) for 8 weeks (n=6–8 per group, *P<0.05 when comparing HFD-WT to HFD-14-3-3ζOE mice, assessed by Student's t-test). (d,e) WT or 14-3-3ζOE mice were subject to DEXA body composition analysis before exposure to high-fat diet (d) or after 8 weeks (e) (n=6–8 per group, *P<0.05, assessed by Student's t-test). (f) Quantitative PCR measurements of mature white adipocyte markers from WT and 14-3-3ζOE mice (n=6–8 per group; *P<0.05, assessed by Student's t-test). (g) Expression profile of remaining 14-3-3 isoforms in inguinal white adipose tissue from WT and 14-3-3ζOE mice (n=5 per group). (h,i) Glucose tolerance (2 g kg−1 b.w.; h) and insulin tolerance (1.5 U kg−1 b.w.; i) tests were administered to WT or 14-3-3ζOE mice after 8 weeks of high-fat diet exposure (n=6–8 per group, *P<0.05 when comparing WT-LFD with WT-HFD, $P<0.05 when comparing 14-3-3ζOE-LFD with 14-3-3ζOE-HFD, assessed by one-way ANOVA). (j,k) Glucose tolerance (j) and insulin tolerance (0.75 U kg−1 b.w.; k) tests were administered to WT or 14-3-3ζOE mice after 2 weeks of high-fat diet exposure (n=5–9 per group; *P<0.05, assessed by two-way ANOVA when comparing WT-LFD with 14-3-3ζOE–LFD). Error bars represent s.e.m.

