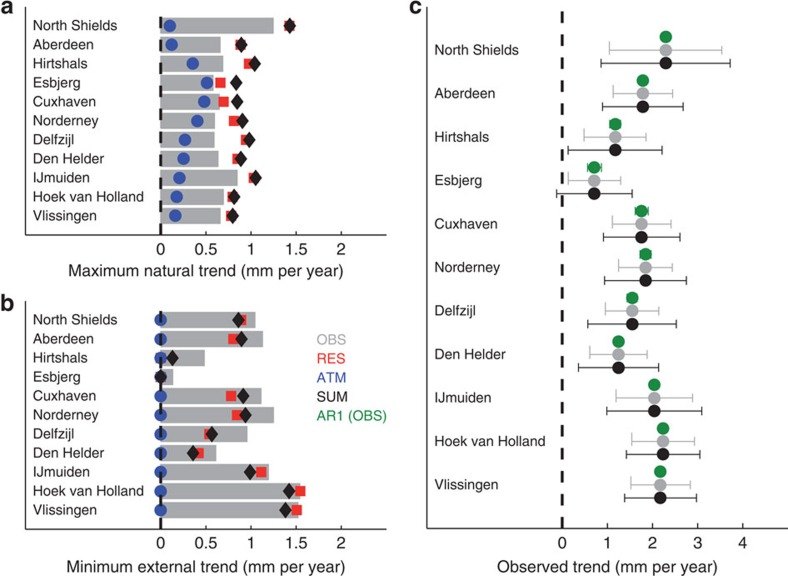
Figure 3. Maximum natural and minimum/maximum external trends in LMSL at tide gauges in the North Sea.
(a) Maximum natural trends (P=0.99) derived by the method from refs 9, 13, 15 for Hurst exponents α estimated with OBS (grey bars), ATM (blue dots), RES (red squares) and the root sum of squares of ATM and RES (SUM, black diamonds) over the period from 1900 to 2011. The corresponding minimum external trends, calculated as the difference between the observed and maximum natural trends, are shown in (b). In (c) the observed trends are shown in its classical expression with their lower and upper 99% confidence bounds (that is, the minimum and maximum external contribution, see also Methods) obtained from OBS (grey) and SUM (black). For comparison also the results for a classical AR1 model are shown (green). Note that the observed trends still contain vertical land motions, which are responsible for the vast majority of the differences obtained between the different stations.

