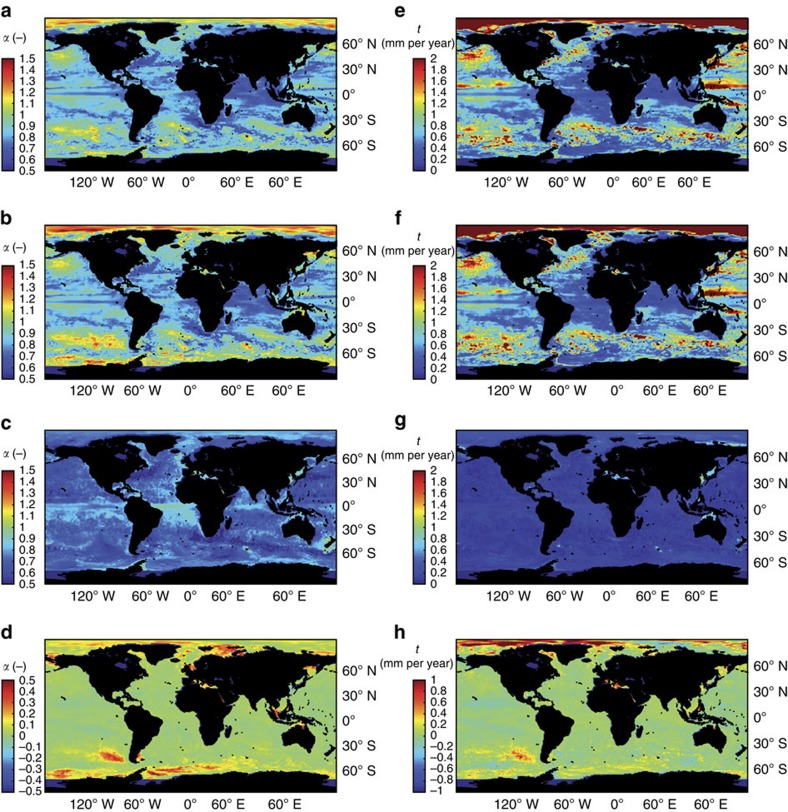
Figure 4. Hurst exponents α and maximum natural centennial trends in modelled LMSLsyn.
(a–c) α values as calculated for different components of LMSLsyn, RESsyn and OBPsyn over the period from 1899 to 2008. (d) Differences between the α values from LMSLsyn and RESsyn. (e–g) Maximum natural trends (P=0.99) for LMSLsyn, RESsyn and OBPsyn fields under the assumption of a short-term (α=0.5) or a long-term correlated (α>0.5) process. (h) Differences between maximum natural trends in sea level derived from an integrated assessment of LMSLsyn minus the root sum of squares of natural trends calculated for OBPsyn and RESsyn separately.

