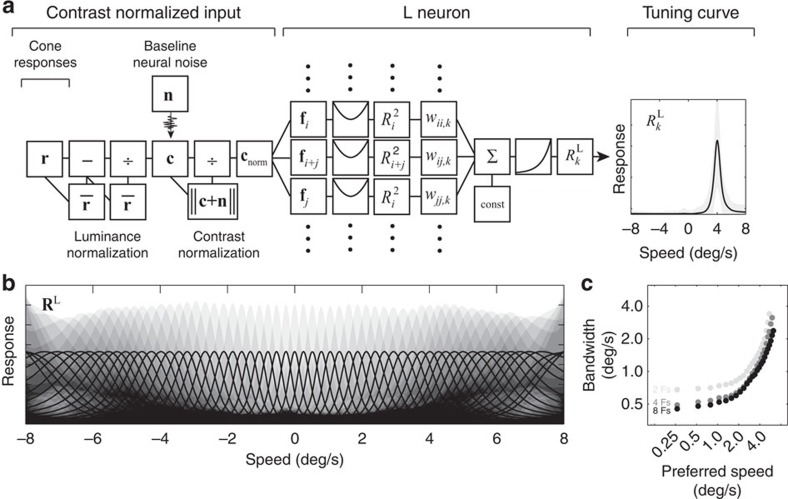
Figure 4. Likelihood neurons for speed estimation.
(a) The response of each speed-tuned neuron, which represents the likelihood of its particular preferred speed, is obtained by appropriate weighted combination of the squared responses of the receptive fields (Fig. 3a). The weights are specified by the receptive field response distributions, conditioned on each speed (see Fig. 3c, Supplementary Note 2)). The speed-tuning curve of each likelihood neuron is much more selective for speed than the space-time receptive fields. (b) Likelihood neurons exhibit log-Gaussian speed-tuning curves, and are largely invariant to irrelevant features in the retinal images (grey area). Speed-tuning curve widths (speed bandwidths) increase systematically with preferred speed. These tuning curves are not cartoons. Rather, they are constructed directly from receptive field responses (see Fig. 3) to natural movies. (c) Preferred speed versus speed bandwidth increases with preferred speed. Tuning curve widths decrease systematically with an increase in the number of receptive fields (subunits) that are combined to produce the L neuron responses.

