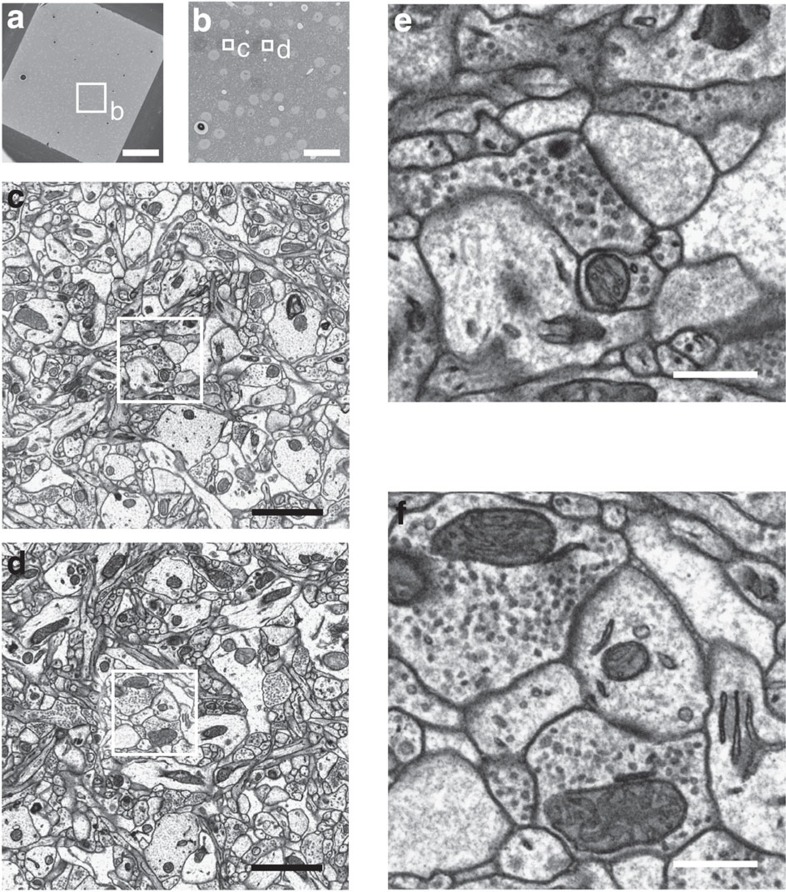
Figure 2. High-resolution screening of ultrastructure and staining contrast at the core of ∼1-mm-sized tissue sample.
(a–d) Position of screening region within sample. (e,f) Two example high-resolution scanning electron microscopy images (imaged at voxel size of 1.35 × 1.35 nm) showing continuous strong membrane contrast in plasma and vesicle membranes, indications of postsynaptic density, and intracellular organelles. Images in e,f were imaged first on a freshly cut block face, and images in a–d were taken afterwards to avoid effects of multiple exposure in the high-resolution images. See Supplementary Fig. 1 for further high-resolution screening results. Scale bars, 200 μm in a, 40 μm in b, 2 μm in c,d and 500 nm in e,f.

