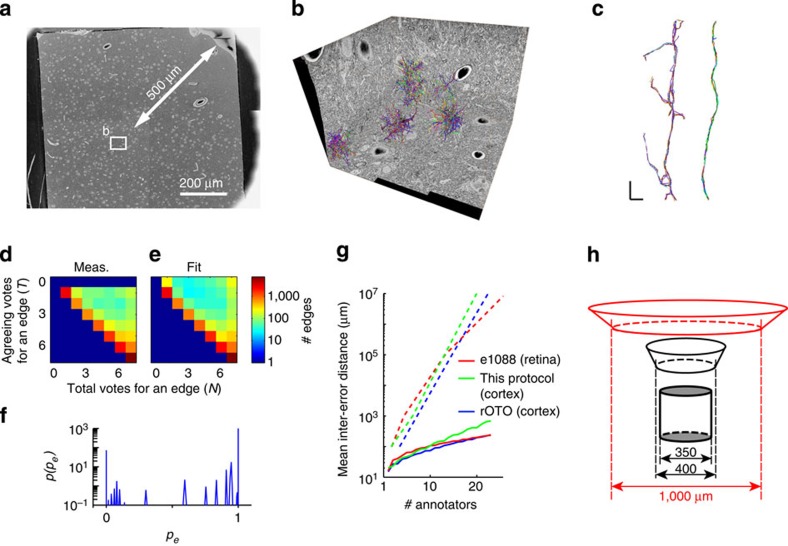
Figure 4. Dense neurite reconstruction in large tissue blocks.
(a,b) Dense neurite reconstruction in a SBEM data set sized 65 × 51 × 41 μm3 from the core (>500 μm from the closest sample surface) of a sample from mouse somatosensory cortex. (a) Overview of sample location (stitched from four overview images); (b) 3D display of SBEM-data set boundaries and all locally dense neurite tracings used for tracing test. (c) Two example neurites reconstructed by seven independent annotators. Note complete agreement (right) and local disagreement when tracing spines (left). (d,e) Measured (d) and fitted (e) vote histogram of tracer agreement reporting the total number of tracers (N) and the agreeing number of tracers (T) for each skeleton-edge (redundancy-corrected, see Methods). (f) fitted distribution of skeleton-edge difficulty (or edge probability) p(pe) from the tracings summarized in d, yielding the fitted vote histogram (e, see RESCOP21 and Methods for details). (g) Prediction of tracing accuracy (for full neurite tracings, continuous lines and for focused re-annotation of the disagreeing locations, dashed lines, see ref. 21) from test tracings for this data set compared with published retina tracings (‘e1088' from ref. 21) and a comparison cortex data set stained with the protocol as shown in Fig. 1b (Boergens et al., unpublished data set). (h) Illustration of sampling challenge when targeting modules in cortex (here: ‘barrels' in mouse S1 layer 4, grey cylinder) using a protocol that can only stain about 400-μm-wide samples (black) compared with the procedural relief when obtaining about 1-mm-wide samples (red). Scale bars, 200 μm (a), 1 μm (c).

