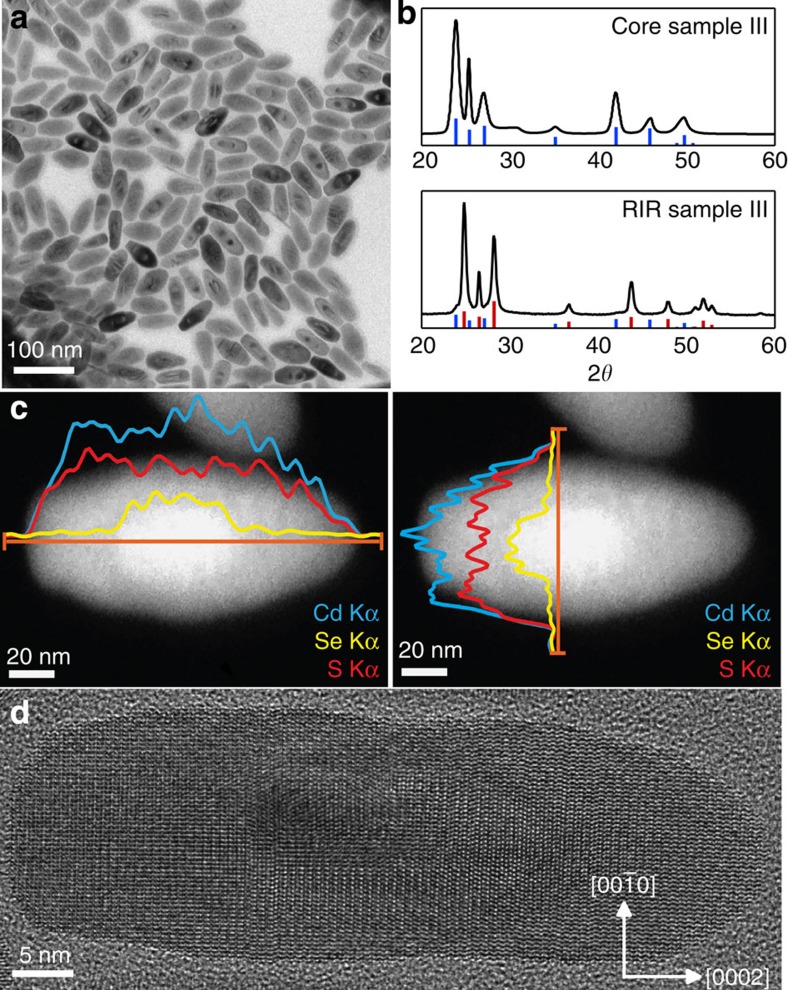
Figure 1. Structural characterization of the RIRs.
(a) Overview TEM of CdSe/CdS RIR sample III. The dark and light areas around the CdSe cores are due to diffraction contrast generated by the local distortion of the lattice near the core/shell interface. (b) XRD patterns of core CdSe nanorods and corresponding core/shell RIRs (sample III). Vertical lines indicate the bulk WZ CdSe (blue) and CdS (red) diffraction angles. (c) HAADF-STEM image of single RIRs, with projected composition determined from the EDS profile (along orange line) of Cd Kα, S Kα and Se Kα signals. (d) HRTEM image of a single RIR (Sample III) showing epitaxial growth of CdSe/CdS core/shell heterostructures.

