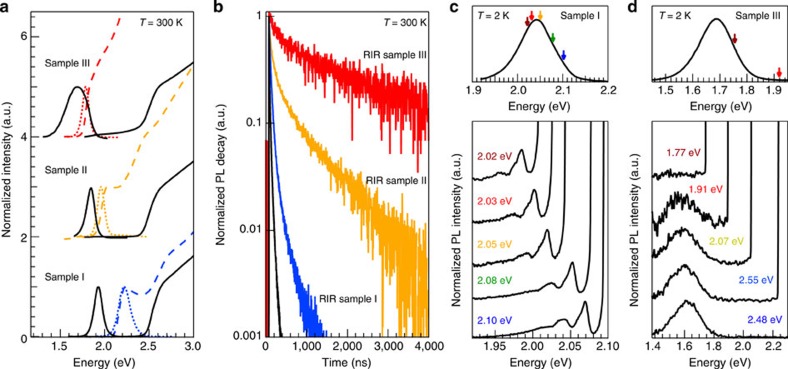
Figure 3. Optical confirmation of the indirect exciton formation.
(a) Room temperature absorbance spectra of CdSe core nanorods (dashed lines) and CdSe/CdS core/shell RIRs (full lines), with corresponding PL spectra of core (dotted lines) and core/shell RIRs (full lines). Note that in RIR sample III, Rayleigh scattering is observed, possibly due to the large RIR volume. (b) Time-resolved PL decay traces of CdSe nanorods (black), and RIR samples I, II and III. We observe a lifetime up to 4.4 μs, for RIR sample III. (c,d) Fluorescence line-narrowing (FLN) spectra at 2 K of quasi-type-II heteroNCs (RIR sample I, c) and type-II heteroNCs (RIR sample III, d). The full PL spectrum under non-resonant excitation at 3.1 eV is plotted on top for reference, with arrows indicating the excitation wavelength.

