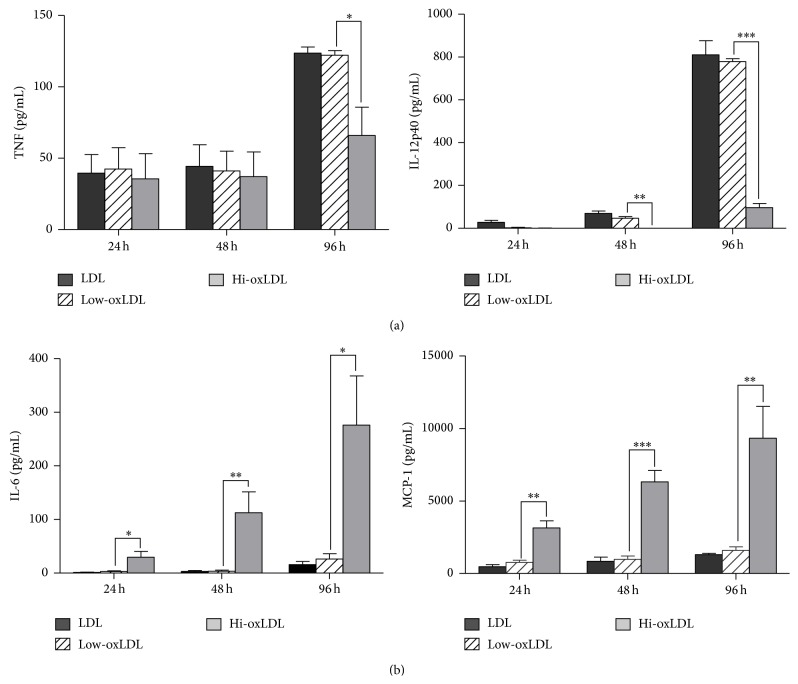
Figure 3.
Production of cytokines and chemokines in response to oxLDL. THP-1 cells were pretreated with differentially oxidized LDL (50 μg/mL) for 24, 48, or 96 h and treated with LPS (100 ng/mL) for 18 h. Culture supernatants were harvested and the levels of TNF-α, IL-12p40, IL-6, and MCP-1 were measured by ELISA. Data represent means ± S.E. of three independent experiments. One-way ANOVA analysis was used to determine significance (∗ p < 0.05, ∗∗ p < 0.01, and ∗∗∗ p < 0.001).

