. 2015 Aug 12;4:e05005. doi: 10.7554/eLife.05005

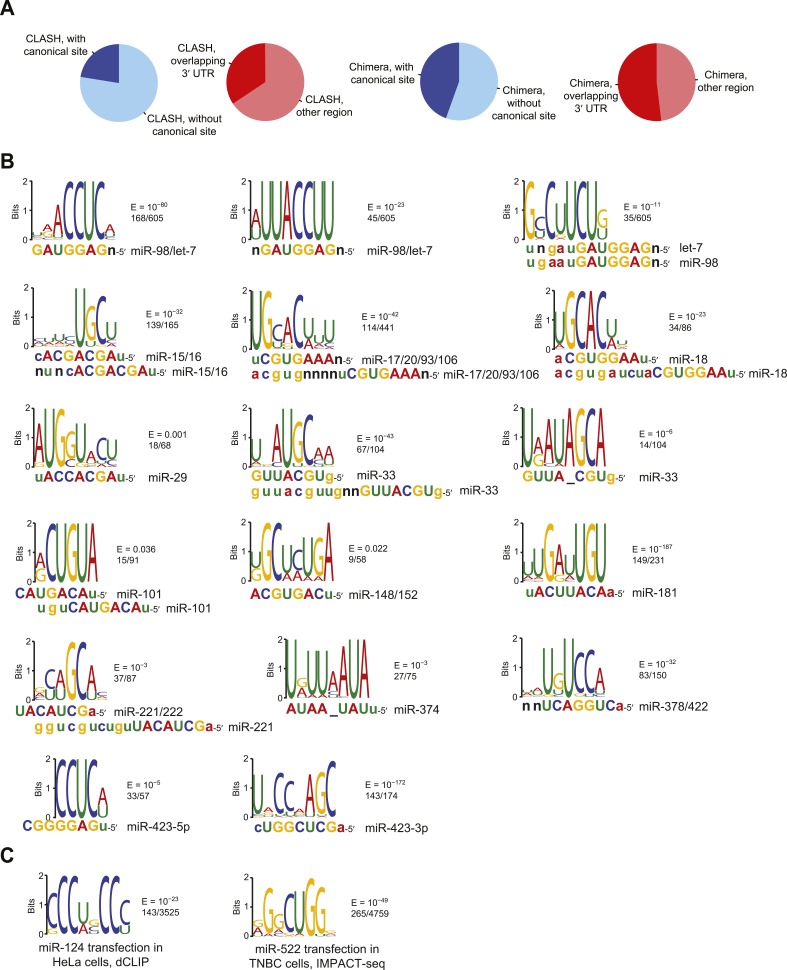
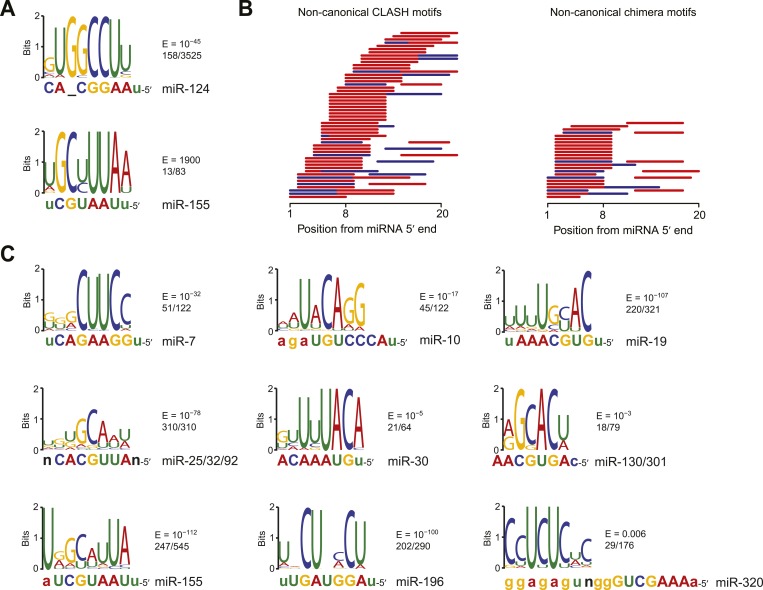
Figure 2. Confirmation of experimentally identified non-canonical miRNA binding sites.

(A) Sequence logos corresponding to motifs enriched in dCLIP clusters that either appear following transfection of miR-124 into HeLa cells (Chi et al., 2009) (top) or disappear following knockout of miR-155 in T cells (Loeb et al., 2012) (bottom). Shown to the right of each logo is its E-value among clusters lacking a seed-matched or offset-6mer canonical site and the fraction of these clusters that matched the logo. Shown below each logo are the complementary regions of the cognate miRNA family, highlighting nucleotides 2–8 in capital letters. (B) Position of the top-ranked motif corresponding to non-canonical sites enriched in CLASH (Helwak et al., 2013) (left) or chimera (Grosswendt et al., 2014) (right) data for each human miRNA family supported by at least 50 interactions without a seed-matched or offset-6mer canonical site. For each family the most enriched logo was aligned to the reverse complement of the miRNA. In cases in which a logo mapped to multiple positions along the miRNA, the positions with the best and second best scores are indicated (red and blue, respectively). (C) Sequence logos of motifs enriched in chimera interactions that lack canonical sites. As in (A), but displaying sequence logos identified in the chimera data of panel (B) for a sample of nine human miRNAs. Logos identified for the other human miRNAs are also provided (Figure 2—figure supplement 1B). A nucleotide that differs between miRNA family members is indicated as a black ‘n’.

DOI: http://dx.doi.org/10.7554/eLife.05005.009

Figure 2.

Figure 2—figure supplement 1. Comparison of CLASH and chimera data and identification of motifs enriched in human chimera interactions that lack canonical sites.

Figure 2—figure supplement 1.

(A) Comparison of CLASH (left) and chimera (right) reads from human cells, showing the proportion possessing a canonical site (blue) and overlapping 3′ UTRs (red). In total, 18,514 CLASH and 10,567 chimera interactions were analyzed. (B) Sequence logos of motifs enriched in chimera interactions that lack canonical sites. This panel is as in Figure 2C but displays the remaining motifs identified from the chimera data analyzed in Figure 2B. In cases of alignment ambiguity, both alignments are shown below the logo. For some miRNA families, multiple motifs were significantly enriched (E ≤ 0.001) and are shown separately. Significantly enriched motifs (or a top-ranked motif matching the miRNA) were not found for miR-21, and miR-3168 was excluded from the analysis due to poor support for its authenticity as a miRNA. (C) Sequence logos of motifs that do not match the cognate miRNA but are nonetheless enriched in miR-124 dCLIP (Chi et al., 2009) and miR-522 IMPACT-seq (Tan et al., 2014) clusters that lack canonical sites to the miRNA. The miR-124 logo was nearly identical to a non-specific motif previously identified as enriched in CLIP data from the mouse brain (Chi et al., 2012). The miR-522 logo was found instead of the previously reported miRNA-matching logo (Tan et al., 2014).
Figure 2—figure supplement 2. Identification of motifs enriched in mouse and nematode chimera interactions that lack canonical sites.

Figure 2—figure supplement 2.

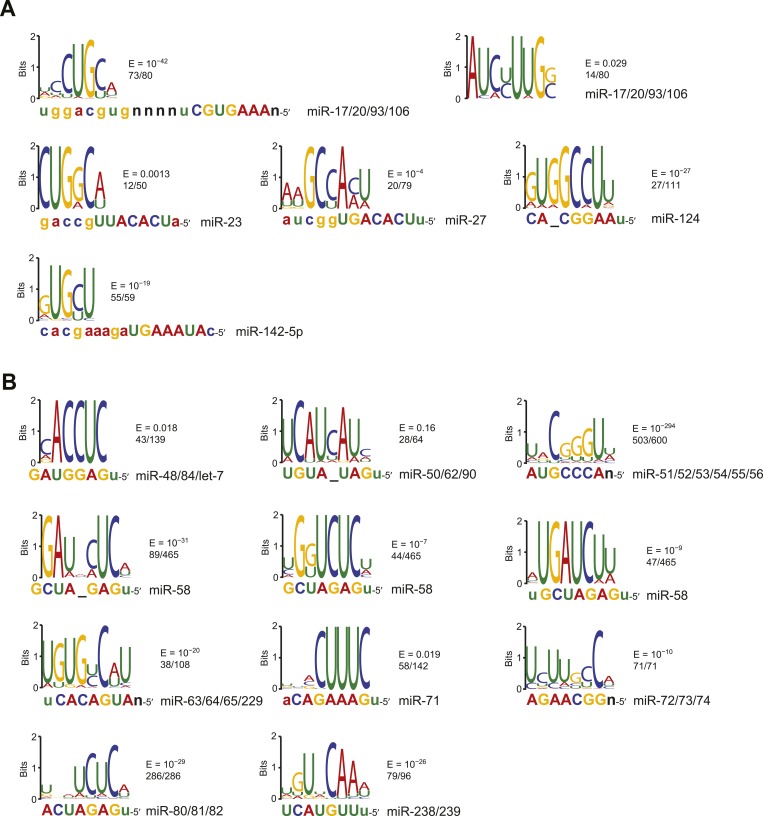
(A) Sequence logos of motifs enriched in M. musculus chimera interactions that lack canonical sites; otherwise as in Figure 2C. Significantly enriched motifs (or a top-ranked motif matching the miRNA) were not found for let-7 and miR-142-3p. (B) Sequence logos of motifs enriched in C. elegans chimera interactions that lack canonical sites; otherwise as in Figure 2C. Significantly enriched motifs (or a top-ranked motif matching the miRNA) were not found for miR-1.