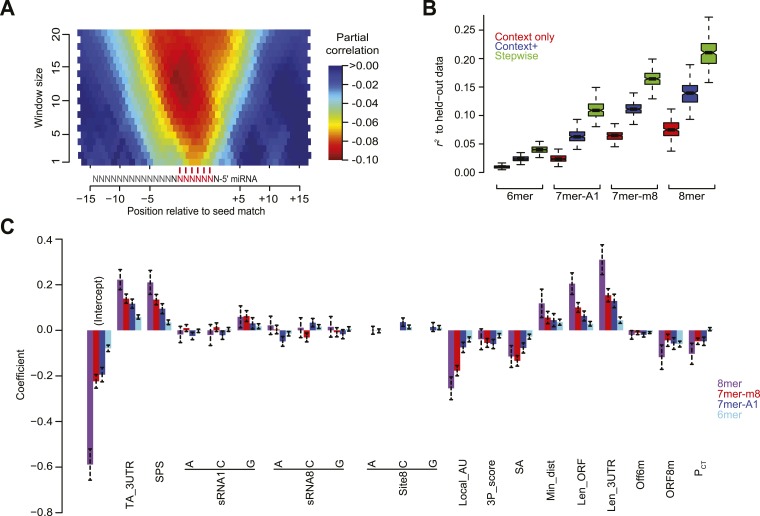
Figure 4. Developing a regression model to predict miRNA targeting efficacy.
(A) Optimizing the scoring of predicted structural accessibility. Predicted RNA structural accessibility scores were computed for variable-length windows within the region centered on each canonical 7–8 nt 3′-UTR site. The heatmap displays the partial correlations between these values and the repression associated with the corresponding sites, determined while controlling for local AU content and other features of the context+ model (Garcia et al., 2011). (B) Performance of the models generated using stepwise regression compared to that of either the context-only or context+ models. Shown are boxplots of r2 values for each of the models across all 1000 sampled test sets, for mRNAs possessing a single site of the indicated type. For each site type, all groups significantly differ (P < 10−15, paired Wilcoxon sign-rank test). Boxplots are as in Figure 3C. (C) The contributions of site type and each of the 14 features of the context++ model. For each site type, the coefficients for the multiple linear regression are plotted for each feature. Because features are each scored on a similar scale, the relative contribution of each feature in discriminating between more or less effective sites is roughly proportional to the absolute value of its coefficient. Also plotted are the intercepts, which roughly indicate the discriminatory power of site type. Dashed bars indicate the 95% confidence intervals of each coefficient.
DOI: http://dx.doi.org/10.7554/eLife.05005.015

