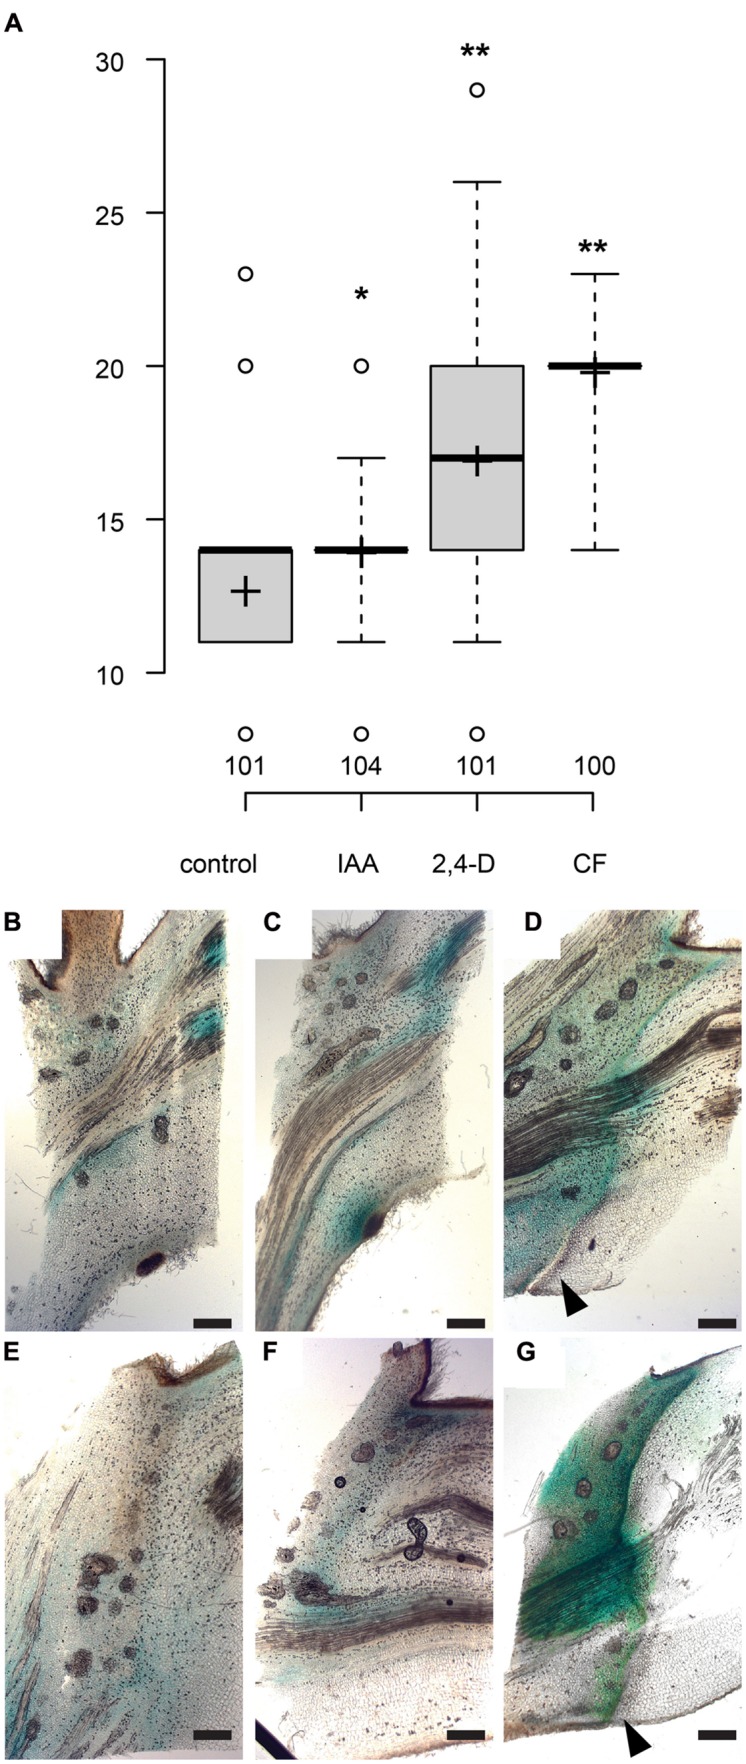
FIGURE 4.

The auxin transport inhibitor morphactin delays abscission. (A) Box plot, center lines show the medians; box limits indicate the 25th and 75th percentiles; whiskers extend to 5th and 95th percentiles, outliers are represented by dots; crosses represent sample means. Number of observations indicated above the x-axis. ∗p < 0.05, ∗∗p < 0.01, t-test. (B–G) Formation of new auxin response maximum and abscission zone is delayed by morphactin. GH3::GUS (Teichmann et al., 2008). (B–D) Mock treatment, lanolin paste locally applied to abscission zone. (E–G) Lanolin paste containing 50 μM morphactin (CF) was applied to the leaf axils. 0 (B,E), 6 (C), 12 (D,F), and 18 days (G) after shading started; scale bars, 500 μm. (D,G) Arrowheads point to the abscission zone.
